Beyond Lipinski's Rules: Advanced Strategies for Optimizing Molecular Similarity in Lead Optimization
This article provides a comprehensive guide for medicinal chemists and drug discovery scientists on implementing and refining molecular similarity constraints during lead optimization.
Beyond Lipinski's Rules: Advanced Strategies for Optimizing Molecular Similarity in Lead Optimization
Abstract
This article provides a comprehensive guide for medicinal chemists and drug discovery scientists on implementing and refining molecular similarity constraints during lead optimization. We explore the fundamental theory behind molecular similarity metrics, detail practical methodologies for their application in scaffold hopping and property optimization, address common pitfalls and optimization strategies, and compare validation techniques. By synthesizing current best practices, this resource aims to enhance the efficiency of navigating chemical space while maintaining desired biological activity.
Molecular Similarity 101: Defining Metrics, Scaffolds, and the Similarity-Property Principle
Technical Support Center: Troubleshooting Molecular Similarity Analysis
FAQs & Troubleshooting Guides
Q1: Our matched molecular pair (MMP) analysis shows unexpected, discontinuous property changes (e.g., a sharp drop in solubility) despite high structural similarity. What could be the cause? A: This often indicates a violation of the "similarity-property principle" due to a critical substructure change. Investigate the following:
- Hidden Functional Group Transformation: The paired molecules may differ in a key ionizable group or hydrogen bond donor/acceptor count that is not captured by your primary fingerprint (e.g., ECFP4).
- Conformational or Tautomeric State: The minor change may lock the molecule into a different bioactive conformation or tautomeric form, drastically altering physicochemical properties.
- Troubleshooting Protocol:
- Re-calculate descriptors: Beyond Tanimoto similarity, compute and compare specific property profiles: pKa, topological polar surface area (TPSA), and logP.
- Perform a shape overlay: Use ROCS or a similar tool to assess 3D similarity. A low shape similarity score can explain the property cliff.
- Check for known activity cliffs: Query databases like CHEMBL to see if the structural pair is a known property/activity cliff case.
Q2: When applying similarity constraints in virtual screening, how do we balance retrieving novel chemotypes with avoiding "obvious" analogs? A: This is an optimization of the similarity threshold. A threshold that is too high leads to analog redundancy; too low risks irrelevant hits.
- Recommended Action:
- Define a Multi-Parameter Objective: Set targets for: a) Mean similarity to lead, b) Number of unique Bemis-Murcko scaffolds, c) Predicted ADMET score.
- Iterative Screening Protocol:
- Step 1: Run an initial screen with a relaxed similarity constraint (Tanimoto > 0.7).
- Step 2: Cluster results by scaffold.
- Step 3: Apply a per-cluster diversity picker to select the top 2-3 compounds by predicted property profile.
- Step 4: Visually inspect selections for "obvious" analogs and adjust threshold for the next run.
Q3: Our QSAR model, built on a congeneric series, fails to predict properties for structurally similar external compounds. Have we overfitted the similarity constraint? A: Likely yes. The model may have learned series-specific artifacts, not general structure-property relationships.
- Diagnosis and Correction Protocol:
- Apply the "Applicability Domain" (AD) test. Calculate the leverage (h) for each failed external compound. If h > 3p/n (where p=model descriptors, n=training molecules), the compound is outside the model's reliable AD.
- Re-train with broader data: Augment the training set with 20-30% of diverse, non-congeneric molecules that share the target property. This penalizes over-reliance on narrow similarity.
- Validate with Y-Randomization: Ensure your model's performance (R², Q²) significantly drops upon scrambling the target property values, confirming it's not modeling noise.
Experimental Protocols for Key Cited Studies
Protocol 1: Establishing a Quantitative Similarity-Property Relationship (QSPR) for Aqueous Solubility Objective: To model the relationship between molecular similarity and solubility logS across a diverse chemical space. Methodology:
- Dataset Curation: Assemble a set of 2000 drug-like molecules with reliable experimental logS values (e.g., from AQUASOL database).
- Descriptor Calculation: Generate ECFP6 fingerprints and a set of 200 1D/2D molecular descriptors (e.g., MW, logP, TPSA, HBD/HBA count) for all molecules.
- Similarity Matrix: Compute the all-vs-all Tanimoto similarity matrix using the ECFP6 fingerprints.
- Modeling: For each target molecule, identify its 50 nearest neighbors. Build a local Random Forest model using the 200 molecular descriptors from these neighbors to predict the target's logS.
- Validation: Perform 5-fold cross-validation and test on a held-out external set of 500 molecules. Correlate prediction error with the mean similarity of the target molecule to its nearest neighbors in the training set.
Protocol 2: Identifying and Validating "Activity Cliffs" via Matched Molecular Pairs (MMP) Analysis Objective: To systematically find and explain large changes in potency (>2 log units) from single, small structural changes. Methodology:
- Data Preparation: Input a structure-activity relationship (SAR) table of 10,000 compounds with IC50 values against a kinase target.
- MMP Generation: Use the
mmpdbopen-source platform to fragment all molecules and identify all matched molecular pairs (maximum heavy-atom change = 10). - ΔpIC50 Calculation: For each MMP, calculate the absolute difference in pIC50 (-log10(IC50)). Flag pairs with ΔpIC50 > 2.0 as potential cliffs.
- Structural Context Analysis: For each flagged cliff, extract and visualize the changing substructure in the context of the co-crystallized protein-ligand complex (if available). Manually annotate the interaction loss/gain (e.g., key hydrogen bond, hydrophobic contact).
- Experimental Validation: Select 3-5 cliff pairs for chemical synthesis and confirmatory bioassay in triplicate.
Table 1: Performance of Similarity-Based vs. Structure-Based Property Prediction Models
| Model Type | Training Set Size | Test Set Size | Mean Absolute Error (MAE) | R² (External) | Optimal Similarity Threshold |
|---|---|---|---|---|---|
| Local Similarity QSPR (ECFP6) | 1500 | 500 | 0.52 logS units | 0.71 | Tanimoto > 0.65 |
| Global Random Forest (Descriptors) | 1500 | 500 | 0.61 logS units | 0.65 | N/A |
| Graph Neural Network (GNN) | 1500 | 500 | 0.48 logS units | 0.75 | N/A |
Table 2: Analysis of Matched Molecular Pairs (MMPs) from a Kinase Inhibitor Dataset
| MMP Transform (R1 -> R2) | Frequency in Dataset | Avg. ΔpIC50 | % Classified as "Activity Cliff" (ΔpIC50>2) |
|---|---|---|---|
| -Cl -> -CF₃ | 45 | 1.2 | 11% |
| -H -> -CN | 120 | 0.8 | 5% |
| Cyclopropyl -> tert-Butyl | 28 | 2.4 | 39% |
| -OH -> -NH₂ | 65 | 1.7 | 22% |
Visualizations
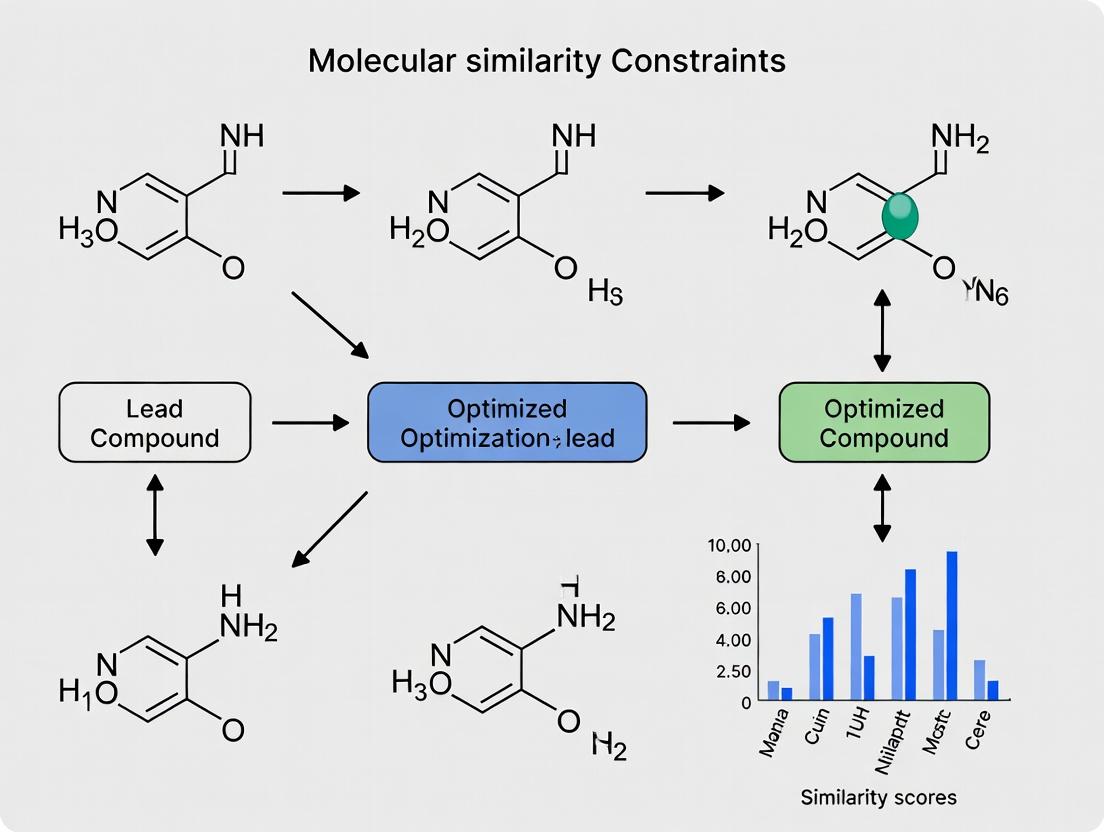
Workflow for Lead Optimization Using Similarity Constraints
Logic of an Activity Cliff Event
The Scientist's Toolkit: Research Reagent Solutions
| Item | Vendor Examples (for illustration) | Primary Function in Similarity-Property Research |
|---|---|---|
| ECFP/RDKit Fingerprints | RDKit (Open Source), ChemAxon | Encodes molecular structure into a bit string for rapid similarity calculation (Tanimoto coefficient). |
| mmpdb Software | Open Source (https://github.com/rdkit/mmpdb) | Systematically identifies all matched molecular pairs within a dataset to analyze SAR. |
| KNIME or Pipeline Pilot | KNIME AG, Dassault Systèmes | Creates visual, reproducible workflows for integrating similarity searching, property prediction, and data analysis. |
| Local QSPR Modeling Suite | Scikit-learn (Python), rcdk (R) | Builds machine learning models (e.g., Random Forest) on similar compounds to predict properties for new analogs. |
| Shape Overlay Tool (ROCS) | OpenEye ROCS | Computes 3D shape and chemical feature similarity, crucial for explaining 2D-similarity property cliffs. |
| High-Throughput Solubility Assay Kit | Cyprotex Solubility (CLND), Sirius T3 | Provides rapid experimental solubility (logS) data to validate and refine similarity-property models. |
Technical Support Center: Troubleshooting & FAQs
Frequently Asked Questions
Q1: Our similarity search using ECFP4 fingerprints is returning too many candidate molecules, overwhelming our virtual screening pipeline. How can we refine the constraints? A1: This is a common issue when the initial similarity threshold is set too low. Implement a tiered filtering approach:
- First, apply a higher Tanimoto similarity cutoff (e.g., >0.4) using ECFP4.
- For molecules passing this filter, calculate a second similarity metric using a pharmacophore fingerprint or a keyed descriptor like MOE2D. Integrate these scores using a weighted sum.
- Protocol: Tiered Similarity Screening
- Generate ECFP4 (radius=2) fingerprints for your query lead compound and the database.
- Calculate pairwise Tanimoto coefficients. Retain molecules with Tc > 0.4.
- For the retained set, generate Pharmacophore Fingerprints (e.g., RDKit's
Generate.Gen2DFingerprint). - Calculate a second Tanimoto similarity.
- Apply a weighted consensus score:
Final_Score = (0.7 * ECFP4_Tc) + (0.3 * Pharma_Tc). - Rank by
Final_Scoreand select the top 5% for further analysis.
Q2: We observe a poor correlation between 2D fingerprint similarity (MACCS) and biological activity in our lead series. What alternative descriptors should we consider? A2: MACCS keys are broad-brush descriptors. For optimizing towards a specific biological target, shift to 3D or conformationally-aware descriptors.
- Solution: Use the
ElectroshapeorCovalent Shapedescriptors that incorporate steric and electronic fields. Alternatively, employ theSCRdescriptor for scaffold-focused analysis. - Protocol: 3D Similarity Analysis with RDKit
- Generate a multi-conformer model for your query and candidate molecules (
ETKDGmethod, 50 conformers). - Align each candidate conformer to the query using
rdMolAlign.GetCrippenO3A. - Calculate the best-fit RMSD and retain the pose with the minimum value.
- For the aligned pair, compute the
3D Pharmacophore Fingerprint(rdkit.Chem.Pharm2D.SigFactory) to capture spatial feature alignment.
- Generate a multi-conformer model for your query and candidate molecules (
Q3: When generating ECFP fingerprints, how do we choose the optimal radius and bit length for a target-specific project? A3: The choice is a trade-off between specificity and generalizability. Use systematic benchmarking.
- Protocol: Parameter Optimization for ECFP
- Prepare a validation set of 50 known actives and 950 decoys for your target.
- Generate ECFP fingerprints with varying radii (R=1,2,3,4) and bit lengths (512, 1024, 2048).
- For each parameter set, use your lead molecule as a query to perform a similarity search (Tanimoto).
- Calculate the Enrichment Factor at 1% (EF1%) for each set.
- Select the parameter combination that yields the highest EF1%, indicating the best ability to prioritize actives early in a virtual screen.
Table 1: Performance Comparison of Key Molecular Fingerprints in Virtual Screening
| Descriptor Type | Typical Bit Length | Typical Similarity Metric | Computational Speed | Interpretability | Best Use Case |
|---|---|---|---|---|---|
| MACCS Keys | 166 | Tanimoto | Very Fast | High | Rapid, broad pre-screening & scaffold hopping |
| ECFP4 | 1024 (default) | Tanimoto | Fast | Low | Capturing complex functional group relationships |
| FCFP4 | 1024 (default) | Tanimoto | Fast | Very Low | Bioactivity-focused similarity, ignoring chemistry |
| Pattern Fingerprint | 2048 (default) | Tanimoto | Moderate | Medium | Substructure search, patent mining |
| Pharmacophore Fingerprint | Varies | Tanimoto/Dice | Moderate | High | Binding mode-centric lead optimization |
| 2D Atom Pairs | Varies | Tanimoto | Fast | Medium | Similarity for large, diverse libraries |
Table 2: Troubleshooting Guide for Common Descriptor Issues
| Symptom | Likely Cause | Recommended Solution | Verification Protocol |
|---|---|---|---|
| High similarity scores but low activity | Descriptor lacks 3D/physicochemical info | Switch to 3D shape or field-based descriptors (e.g., Electroshape). | Test correlation of new descriptor similarity with pIC50 in a congeneric series. |
| Unstable similarity rankings | Use of hashed fingerprints with collisions | Increase bit length to 2048 or 4096. Use folded counts instead of bits. | Generate same fingerprint twice; ensure bit strings are identical. |
| Missed obvious analogs | Radius too small (ECFP) or key missing (MACCS) | Increase ECFP radius to 3. Customize MACCS key definitions. | Perform a substructure search to confirm analogs exist in set. |
| Poor scaffold hopping performance | Over-reliance on atom-type in fingerprint | Use FCFP (function-class) instead of ECFP. | Check if known bio-isosteres are retrieved in similarity search. |
Experimental Protocols
Protocol 1: Generating and Comparing Standard 2D Fingerprints Objective: To compute and compare MACCS, ECFP4, and Pattern fingerprints for a set of molecules.
- Input: SD file containing 1000 compounds.
- Fingerprint Generation (using RDKit):
- MACCS:
maccs_fp = rdMolDescriptors.GetMACCSKeysFingerprint(mol) - ECFP4:
ecfp4_fp = AllChem.GetMorganFingerprintAsBitVect(mol, radius=2, nBits=1024) - Pattern:
pattern_fp = rdMolDescriptors.GetHashedAtomPairFingerprintAsBitVect(mol, nBits=2048)
- MACCS:
- Similarity Calculation: For a query molecule
qmol, compute Tanimoto similarity to all database moleculesdb_mol[i]using:DataStructs.TanimotoSimilarity(q_fp, db_fp[i]). - Analysis: Rank compounds by similarity and inspect top 20 structures for each fingerprint type.
Protocol 2: Implementing a Shape-Based Similarity Workflow Objective: To rank molecules based on 3D shape overlap with a lead compound.
- Conformer Generation: For query and all candidates, generate 50 conformers using RDKit's
ETKDGv3. - Shape Alignment & Scoring: Use the
ShapeTanimotoDistmethod from RDKit'srdMolAlign.- For each candidate, align all conformers to the query's reference conformer.
- Retain the maximum Shape Tanimoto similarity score.
- Integration with 2D Filters: Combine shape score (weight=0.6) with ECFP4 similarity (weight=0.4) for a final rank-ordered list.
Visualizations
Title: Molecular Similarity Screening Workflow
Title: Fingerprint Selection Decision Tree
The Scientist's Toolkit: Research Reagent Solutions
Table 3: Essential Software & Toolkits for Molecular Fingerprinting
| Tool/Software | Function | Key Feature for Lead Optimization |
|---|---|---|
| RDKit (Open-source) | Core cheminformatics toolkit for generating fingerprints (MACCS, ECFP/FCFP, Pharmacophore), similarity calculations, and scaffold analysis. | Seamless integration of 2D similarity with 3D conformation generation and alignment. |
| OpenEye Toolkit (Commercial) | High-performance library for ROCS (shape similarity), EON (electrostatic similarity), and OEChem fingerprinting. | Industry-leading speed and accuracy for 3D shape-based virtual screening. |
| Schrödinger Canvas (Commercial) | Provides a wide array of descriptors (including FEP+ ready), fingerprint types, and advanced similarity search methods. | Direct linkage from similarity search to physics-based binding affinity prediction (FEP+). |
| KNIME / Pipeline Pilot | Visual workflow automation platforms for building reproducible, large-scale descriptor calculation and screening pipelines. | Enables complex, tiered similarity protocols with audit trails, crucial for project optimization. |
| CDK (Chemistry Development Kit) (Open-source) | Java-based library for descriptor calculation, including topological and geometrical indices. | Useful for calculating complementary 2D descriptors to augment fingerprint-based similarity. |
Frequently Asked Questions (FAQs)
Q1: During virtual screening, my Tanimoto similarity search for a benzodiazepine scaffold is returning very few hits despite a large library. What could be the issue?
A1: The Tanimoto coefficient (TC), particularly when using common fingerprints like ECFP4, is sensitive to molecular size. Benzodiazepine cores are relatively large, so comparing them to smaller fragments results in low TCs because the denominator (union bit count) is dominated by the larger molecule. To troubleshoot:
- Solution 1: Use the Tversky index, which is an asymmetric measure. Set α=0.9 and β=0.1 to bias the similarity towards the features present in your large query molecule, making it more forgiving of extra features in the database molecules.
- Solution 2: Switch to a reduced graph fingerprint that abstracts the scaffold to core features, or use a scaffold hopping-oriented fingerprint like MOLPRINT2D.
- Solution 3: Lower your TC cutoff threshold (e.g., from 0.7 to 0.5) and visually inspect top results.
Q2: When clustering a diverse compound set for a pilot screen, why do Cosine and Tanimoto metrics produce drastically different cluster memberships?
A2: Tanimoto (Jaccard) and Cosine similarities weight shared features differently relative to unique features. This is most pronounced with sparse binary vectors (e.g., MACCS keys).
- Root Cause: The Cosine similarity ignores features absent in both molecules (double zeros), focusing only on the intersection in the "present" feature space. Tanimoto includes the union of all features (bits set in either molecule), punishing molecules that have many unique, non-overlapping bits.
- Troubleshooting Protocol: For diverse sets, perform parallel clustering with both metrics and a third metric like Dice (Sørensen-Dice). Analyze the consensus clusters. Molecules that shift groups between metrics are "borderline" and may require expert review for scaffold representation.
Q3: My molecular dynamics simulation results show a high RMSD, but the binding poses look visually similar according to my project lead. Which metric should I trust for pose stability?
A3: Root Mean Square Deviation (RMSD) can be misleading for flexible molecules or those with symmetric moieties. It is a strict, alignment-sensitive Euclidean distance metric.
- Actionable Guide:
- Calculate a supplemental metric: Compute the Tanimoto similarity of the Interaction Fingerprint (IFP) between the poses. This quantifies pharmacophore similarity (e.g., hydrogen bonds, hydrophobic contacts) rather than atomic positions.
- Protocol: Use a tool like
rdkitorSchrödinger's phaseto generate IFP bits. A Tanimoto-IFP > 0.8 usually indicates functionally similar poses despite high RMSD. - Final Decision: Trust the visual inspection and IFP-TC over RMSD for functional pose similarity. Use RMSD primarily for monitoring convergence of the protein backbone.
Data Presentation: Comparison of Key Similarity/Distance Metrics
Table 1: Core Mathematical Definitions & Properties of Key Metrics
| Metric | Formula (Similarity) | Range | Key Property | Best Use Case in Lead Optimization | ||||||||
|---|---|---|---|---|---|---|---|---|---|---|---|---|
| Tanimoto (Jaccard) | ( S_{T} = \frac{ | A \cap B | }{ | A \cup B | } ) | 0 (dissimilar) to 1 (identical) | Binary, symmetric, size-sensitive. | Scaffold hopping, HTS library deduplication. | ||||
| Cosine | ( S_{C} = \frac{A \cdot B}{|A||B|} ) | 0 to 1 | Ignores double absences. Works for continuous & binary. | Text-based descriptor (e.g., SPF) similarity, patent mining. | ||||||||
| Dice (Sørensen-Dice) | ( S_{D} = \frac{2 | A \cap B | }{ | A | + | B | } ) | 0 to 1 | Gives more weight to intersection than Tanimoto. | Bioisostere replacement analysis. | ||
| Tversky Index | ( S_{Tw} = \frac{ | A \cap B | }{\alpha | A \setminus B | + \beta | B \setminus A | + | A \cap B | } ) | 0 to 1 | Asymmetric (α, β parameters). | Patent-infringement search, sub-structure similarity. |
| Euclidean Distance | ( d = \sqrt{\sum{i=1}^{n}(Ai - B_i)^2} ) | 0 to ∞ | True metric, continuous space. | PCA/MDS plots from physicochemical descriptors. | ||||||||
| Manhattan (City-block) | ( dm = \sum{i=1}^{n} | Ai - Bi | ) | 0 to ∞ | Less sensitive to outliers than Euclidean. | Comparing molecular profiles (e.g., toxicity scores). |
Table 2: Troubleshooting Guide: Metric Selection for Common Tasks
| Research Task | Recommended Primary Metric | Rationale | Potential Pitfall & Alternative |
|---|---|---|---|
| Virtual Screening (2D) | Tanimoto (ECFP4) | Industry standard, good balance of recall & precision. | Size bias. Try Tversky (α=0.9, β=0.1). |
| 3D Shape/Shape+Color | Cosine or Tanimoto (ROCS) | Cosine for continuous shape densities; Tanimoto for color atom counts. | Conformer dependence. Use multi-conformer consensus. |
| SAR Landscape Analysis | Combined: Euclidean (PC space) & Dice (Fingerprint) | Euclidean captures global trends; Dice captures local feature swaps. | Over-interpreting single metric clusters. Always use both. |
| Sequence Similarity (Proteins) | Normalized Edit Distance or Cosine (k-mer) | Edit distance for alignments; Cosine for fast k-mer vector comparison. | Not directly related to function. Use with caution. |
Experimental Protocols
Protocol 1: Benchmarking Fingerprint & Metric Combinations for Scaffold Hopping
Objective: To identify the optimal fingerprint-metric pair for retrieving diverse, active analogues of a known kinase inhibitor.
Materials: ChEMBL dataset for a specific kinase (e.g., CDK2), known active query molecule, RDKit or KNIME workflow.
Methodology:
- Data Curation: Extract all molecules with IC50 < 10 µM for the target. Cluster (Butina) and split into query set (1 cluster) and reference active set (remaining clusters). Add decoys from DUD-E library.
- Fingerprint Generation: For all compounds, compute 5 fingerprints: MACCS (166 bits), ECFP4 (2048 bits), FCFP4 (2048 bits), RDKit topological (2048 bits), and Avalon (512 bits).
- Similarity Calculation: For each fingerprint, compute pairwise similarity between each query and all reference/decoys using Tanimoto, Dice, and Cosine.
- Evaluation: Plot ROC curves and calculate Enrichment Factor at 1% (EF1%) for each fingerprint-metric combination.
- Analysis: The combination yielding the highest EF1% and earliest curve lift is optimal for scaffold hopping in this chemotype.
Protocol 2: Integrating 2D & 3D Similarity for Binding Mode Hypothesis
Objective: To prioritize compounds from a virtual screen that are likely to share a binding mode with the co-crystallized lead.
Materials: Protein-ligand complex (lead), database of screened hits, docking software (e.g., AutoDock Vina), Open3DALIGN or RDKit 3D toolkit.
Methodology:
- 3D Alignment & Similarity: Generate a multi-conformer ensemble for the lead and each top-100 docked hit. Using the docked pose, perform flexible alignment to the lead's bioactive conformation.
- Calculate 3D Metrics: Compute RMSD and Shape-Tanimoto (via Open3DALIGN) for the aligned pairs.
- Calculate 2D Chemistry Metric: Compute ECFP4-Tanimoto for the lead and each hit.
- Data Fusion: Create a 3D scatter plot (X=Shape-Tanimoto, Y=ECFP4-Tanimoto, Z=docking score). Compounds clustering in the high-Shape/high-2D quadrant are conservative analogues. Compounds in the high-Shape/low-2D quadrant are prime scaffold hop candidates with a high probability of similar binding mode.
Visualization: Workflows and Relationships
Title: Decision Tree for Selecting a Molecular Similarity Metric
Title: Lead Optimization Cycle Driven by Similarity Metrics
The Scientist's Toolkit: Research Reagent Solutions
Table 3: Essential Software & Libraries for Similarity Analysis
| Item (Name & Vendor) | Function in Similarity Quantification | Typical Use Case |
|---|---|---|
| RDKit (Open Source) | Core cheminformatics toolkit. Generates fingerprints (ECFP, MACCS), calculates Tanimoto, Dice, Tversky, aligns 3D molecules. | In-house script development, prototyping new similarity workflows. |
| Open3DALIGN (Open Source) | Command-line tool for optimal 3D molecular alignment and calculation of 3D similarity indices (Shape Tanimoto, etc.). | Post-docking pose comparison, 3D pharmacophore similarity. |
| ROCS (OpenEye) | High-performance tool for rapid 3D shape overlap and "color" (chem feature) similarity scoring. Uses Cosine/Tanimoto. | Large-scale 3D virtual screening, scaffold hopping. |
| KNIME / Pipeline Pilot | Visual workflow platforms with extensive chemoinformatics nodes for fingerprinting, similarity search, and clustering. | Reproducible, documented similarity analysis pipelines for team use. |
| SciPy / scikit-learn (Python) | Provides efficient functions for calculating Cosine, Euclidean, Manhattan distances, and advanced clustering (DBSCAN, HDBSCAN). | Building custom ML models incorporating molecular similarity. |
| Schrödinger Canvas | Generates aligned fingerprint descriptors (APFP) and provides sophisticated similarity and scaffold network analysis. | Patent analysis, lead series exploration in a GUI environment. |
Technical Support Center
Troubleshooting Guides & FAQs
Q1: My virtual screening results yield too many diverse hits, making it difficult to prioritize. How can I refine my similarity constraints? A1: Overly broad similarity constraints often stem from using a single, generic molecular descriptor. Implement a multi-descriptor consensus approach. Set up the following protocol:
- Calculate Descriptors: For each hit, compute at least three distinct descriptor types: a) 2D MACCS Keys (structural fingerprints), b) ECFP6 (circular fingerprints for substructure), c) Physicochemical property vector (MW, LogP, TPSA, HBD, HBA).
- Define Thresholds per Descriptor: Establish separate, rigorous similarity thresholds based on known actives in your series.
- Consensus Filtering: Retain only compounds that satisfy at least two of the three threshold criteria.
Q2: When applying a Tanimoto similarity threshold (Tc > 0.7) to my lead series, I lose promising analogs with significant potency gains. What's wrong? A2: The Tanimoto coefficient (Tc) based on standard fingerprints is sensitive to small, critical structural changes. The compound may be a "activity cliff" pair. Implement a matched molecular pair (MMP) analysis to identify isolated, transformative modifications.
- Protocol: MMP Analysis:
- Identify the core structure shared between your high-potency analog and the lead.
- Precisely define the single chemical transformation (e.g., -OH → -CF3 at position R4).
- Search your database or Enamine REAL Space for all compounds sharing this exact transformation from your lead scaffold.
- This isolates the specific effect of that R-group change on activity, independent of global similarity.
Q3: How do I quantitatively balance structural similarity with novel IP space during scaffold hopping? A3: You need to define and measure a "novelty score" alongside similarity. Use a protocol based on Bemis-Murcko scaffolds and fingerprint distance to a reference set.
- Decompose Molecules: Generate the Bemis-Murcko scaffold (ring systems + linkers) for your lead and all candidate hops.
- Calculate Scaffold Similarity: Compute the Tc between the ECFP4 fingerprints of the scaffolds.
- Calculate Reference Set Distance: For each candidate, compute the average Tc to all compounds in a large reference set (e.g., ChEMBL). A lower average Tc indicates higher global novelty.
- Decision Matrix: Plot candidates on a 2D grid: Scaffold Similarity (X-axis) vs. Novelty Score (Y-axis). Optimize for the upper-right quadrant (high scaffold similarity, high novelty).
Table 1: Common Molecular Similarity Metrics and Their Typical Lead Optimization Thresholds
| Metric | Description | Typical "Similar Enough" Threshold | Best Use Case |
|---|---|---|---|
| Tanimoto (ECFP4) | Fingerprint-based similarity | 0.5 - 0.7 | General analog searching, library filtering. |
| Tanimoto (MACCS) | 166-bit structural key similarity | > 0.9 | High-fidelity structural analog retrieval. |
| Tversky (α=0.7, β=0.3) | Asymmetric similarity favoring query | > 0.8 | Identifying superstructures of a lead (substructure-sensitive). |
| RMSD (3D Aligned) | Root-mean-square deviation of atom positions | < 1.5 Å | Comparing 3D conformations or pharmacophore overlap. |
Table 2: Impact of Similarity Constraint Tightness on Virtual Screening Outcomes
| Constraint (Tc Min) | Compounds Passing Filter | Hit Rate (%) | Avg. Potency (nM) | Scaffold Diversity (# of Bemis-Murcko Scaffolds) |
|---|---|---|---|---|
| 0.9 | 120 | 15.2 | 45 | 2 |
| 0.7 | 1,850 | 8.1 | 120 | 7 |
| 0.5 | 15,000 | 2.3 | 550 | 32 |
| 0.3 | 85,000 | 0.8 | 1,200 | 89 |
Experimental Protocols
Protocol 1: Establishing a Project-Specific Similarity Threshold Objective: Determine the optimal Tanimoto similarity cutoff for identifying analogs with a high probability of retaining target activity. Method:
- Reference Set Curation: Assemble a set of 50-100 known active compounds for your target from public data (ChEMBL, PubChem).
- Descriptor Calculation: Generate ECFP6 fingerprints for all compounds.
- Pairwise Analysis: Calculate the all-vs-all similarity matrix for the active set.
- Distribution Analysis: Plot the histogram of pairwise similarities among actives.
- Threshold Determination: Set the project similarity threshold at the 10th percentile of this distribution. For example, if 90% of known actives have a pairwise Tc > 0.65, then 0.65 is your project-specific "similar enough" threshold.
Protocol 2: Implementing a 2D Pharmacophore Similarity Search Objective: To find structurally diverse compounds that share key pharmacophoric features with the lead. Method:
- Pharmacophore Definition: From your lead molecule, identify 4-5 key features: Hydrogen Bond Donor (HBD), Hydrogen Bond Acceptor (HBA), Aromatic Ring (AR), Positive Ionizable (PI), Hydrophobic (HY).
- Query Creation: Using tools like RDKit or Phase (Schrödinger), create a 2D pharmacophore query specifying distances/angles between features.
- Database Screening: Screen an in-house or commercial library (e.g., ZINC20) with the query.
- Post-Processing: Cluster the results by ECFP4 fingerprint to select diverse representatives from each cluster for testing.
Visualizations
Title: Decision Flow for Similarity Constraint Tuning
Title: MMP Analysis Isolates R-Group Effects
The Scientist's Toolkit: Research Reagent Solutions
| Item / Solution | Function in Similarity Analysis |
|---|---|
| RDKit (Open-Source) | Core cheminformatics toolkit for generating molecular descriptors (fingerprints, properties), performing similarity calculations, and MMP analysis. |
| KNIME or Python/Pandas | Workflow/data analysis platforms to automate the calculation of multi-descriptor similarity matrices and apply complex filtering logic. |
| ChEMBL Database | Public repository of bioactive molecules used to build project-specific reference sets for establishing meaningful similarity thresholds. |
| Enamine REAL / ZINC20 | Ultra-large, readily accessible virtual compound libraries for searching structural neighbors and exploring novel chemical space. |
| Schrödinger Phase or MOE | Commercial software suites offering advanced, validated methods for 2D/3D pharmacophore searching and scaffold hopping. |
| Tanimoto Coefficient (Tc) | The primary quantitative metric for comparing molecular fingerprints; defines the "distance" in chemical space. |
| ECFP4/ECFP6 Fingerprints | Extended Connectivity Fingerprints; a standard, information-rich descriptor for capturing molecular topology and substructure. |
Welcome to the Lead Optimization Technical Support Center
This center provides targeted troubleshooting and FAQs for researchers navigating the challenges of applying molecular similarity constraints in lead optimization programs. All content is framed within the thesis of optimizing these constraints to balance the safety of known pharmacophores with the imperative for novel chemical space exploration.
Frequently Asked Questions & Troubleshooting Guides
Q1: Our optimized lead compound maintains >85% Tanimoto similarity to the original hit but shows a 100-fold drop in cellular potency. What are the primary diagnostic steps? A: This indicates a potential failure in molecular context, despite high 2D similarity. Follow this diagnostic protocol:
- Confirm Target Engagement: Use a cellular thermal shift assay (CETSA) or nanoBRET target engagement assay to verify the compound still binds the intended target in cells.
- Analyze Conformational Dynamics: Perform a comparative molecular dynamics (MD) simulation (100 ns) of the original and new compound bound to the target. Pay specific attention to ligand-induced pocket remodeling.
- Check for Undesired Interactions: Use a proteome-wide safety panel (e.g., Eurofins SafetyScreen44) to identify off-target binding that may cause unexpected cytotoxicity or pathway modulation.
Q2: How do we systematically explore novel scaffolds while adhering to a similarity constraint (e.g., Tanimoto coefficient >0.7) for patentability? A: Implement a multi-step computational workflow:
- Pharmacophore-based Virtual Screening: Use the core features of your lead to screen diverse libraries, not just structurally similar ones.
- Matched Molecular Pair Analysis: Identify single, transformative changes (e.g., ring opening, scaffold hop) that maximize novelty while conserving key interactions.
- Apply 3D Similarity Metrics: Use ROCS (Rapid Overlay of Chemical Structures) to align and score based on shape and pharmacophore overlap, which can identify novel chemotypes with similar 3D profiles.
Q3: We observe excellent in vitro potency, but our novel analog (similarity 0.65) has poor PK in rodent models. What are the most likely culprits? A: This often stems from subtle changes in physicochemical properties. Analyze the following parameters compared to your baseline compound:
Table 1: Key Physicochemical Properties Affecting PK
| Property | Optimal Range (Typical) | Impact of Deviation | Tool for Analysis |
|---|---|---|---|
| cLogP | 1-3 | High: Increased metabolism, tissue sequestration. Low: Poor permeability. | Schrödinger's QikProp, OpenEye's FILTER |
| Topological Polar Surface Area (tPSA) | <140 Ų (for oral) | High: Poor membrane permeability, reduced absorption. | RDKit, Molinspiration |
| H-Bond Donors/Acceptors | ≤5/≤10 | High: Poor permeability, increased clearance. | Standard molecular descriptor |
| Solubility (pH 7.4) | >50 µM | Low: Limits absorption and bioavailability. | Kinetic or thermodynamic solubility assay |
| Metabolic Soft Spots | N/A | Presence leads to rapid clearance. | In silico site of metabolism prediction (e.g., StarDrop) |
Experimental Protocol: Parallel Artificial Membrane Permeability Assay (PAMPA) Purpose: To rapidly assess passive transcellular permeability. Method:
- Prepare a 96-well microtiter plate with a donor plate and an acceptor plate, separated by a filter coated with a lipid-infused artificial membrane (e.g., porcine brain lipid in dodecane).
- Add test compound (100 µM) in pH 7.4 buffer to the donor well.
- Fill the acceptor well with pH 7.4 buffer.
- Incubate the assembly for 4-6 hours at 25°C under gentle agitation.
- Quantify compound concentration in both donor and acceptor compartments using UV spectrometry or LC-MS/MS.
- Calculate effective permeability (Pe) using the equation: Pe = -ln(1 - CA/Cequilibrium) / [A * (1/VD + 1/VA) * t], where A is filter area, V is volume, t is time, and C is concentration.
Q4: Our novel scaffold has passed initial assays, but we need to validate its mechanism of action is consistent with the lead series. What's a robust experimental path? A: Employ orthogonal functional and binding assays to confirm the mechanism.
- Functional Assay: Repeat the primary cellular assay with a full dose-response (11-point, 1:3 serial dilution) to confirm potency (IC50/EC50) and efficacy (% control).
- Biophysical Binding Confirmation: Use Surface Plasmon Resonance (SPR) to measure direct binding kinetics (ka, kd, KD) to the purified target protein.
- Pathway Modulation Analysis: Use a phospho-specific ELISA or Western blot to verify the compound modulates the same key downstream signaling nodes as the original lead.
The Scientist's Toolkit: Research Reagent Solutions
Table 2: Essential Materials for Similarity-Constrained Optimization
| Reagent/Kit | Provider Examples | Function in Optimization |
|---|---|---|
| Cellular Thermal Shift Assay (CETSA) Kit | Thermo Fisher, Cayman Chemical | Confirms target engagement in a cellular context, validating the similar compound's mechanism. |
| GPCR / Kinase Profiling Safety Panels | Eurofins, Reaction Biology | Identifies off-target activity that may arise from novel structural elements. |
| Human Liver Microsomes (HLM) | Corning, XenoTech | Assesses metabolic stability and identifies major metabolites. |
| Caco-2 Cell Line | ATCC | A gold-standard model for predicting intestinal permeability and efflux liability. |
| Pathway Reporter Lentiviral Particles | Qiagen, Signosis | Enables stable cell line generation for specific pathway activation/inhibition studies. |
| Fragment Libraries for Growing | Enamine, Life Chemicals | Provides chemically tractable fragments to grow novel analogs from a conserved core. |
Experimental Workflows & Pathway Diagrams
Diagram 1: Balancing Novelty & Similarity in Lead Selection
Diagram 2: Generic Downstream Signaling Pathway Validation
From Theory to Practice: Implementing Similarity Constraints in Your Optimization Workflow
This technical support center addresses common issues encountered when implementing Similarity-Guided Optimization (SGO) campaigns within lead optimization research. SGO strategically balances molecular novelty with structural conservatism to improve drug candidates while managing risk.
Frequently Asked Questions & Troubleshooting Guides
Q1: My similarity-constrained library yields no viable hits. What are the primary parameters to check?
A: This is often a constraint stringency issue. First, verify your similarity threshold and descriptor choice. Overly restrictive Tanimoto similarity (>0.9) with rigid scaffolds can over-constrain the search space. Recommended initial parameters:
- Similarity Metric: ECFP4 fingerprints.
- Initial Threshold: 0.65 - 0.75 Tanimoto coefficient.
- Constraint Type: Apply as a soft penalty in the objective function, not a hard filter.
Q2: How do I handle computational strain when running large-scale, multi-parameter SGO simulations?
A: Optimize your workflow through staging and sampling.
- Pre-Filtering: Use a fast, 2D similarity screen (e.g., MACCS keys) to reduce the initial pool before applying more computationally intensive 3D similarity or property calculations.
- Batch Processing: Split the campaign into focused batches (e.g., by core scaffold).
- Resource Checklist: Ensure adequate RAM (>32 GB for 50k+ compounds) and consider cloud-based parallelization for docking or molecular dynamics steps.
Q3: The optimized compounds maintain similarity but lose critical ADMET properties. How can I balance this trade-off?
A: Integrate predictive ADMET models directly into your objective function. Instead of a single objective (maximize potency, maintain similarity), formulate a multi-parameter optimization (MPO) score:
MPO Score = (α * Potency_Score) + (β * Similarity_Score) + (γ * ADMET_Profile_Score)
Adjust weights (α, β, γ) iteratively based on early results.
Q4: What is the best practice for validating that my similarity constraints are working as intended in the campaign?
A: Implement a control arm. Run a parallel optimization campaign without similarity constraints. Compare the chemical space of the outputs using a Principal Component Analysis (PCA) plot based on key descriptors. The constrained campaign should show a tighter clustering near the lead compound.
Essential Experimental Protocols
Protocol 1: Establishing a Baseline Similarity-Guided Optimization Workflow
- Define Lead Compound & Objective: Select the lead molecule (e.g., Compound A, pIC50 = 6.8) and the primary objective (e.g., improve pIC50 to >8.0).
- Calculate Molecular Descriptors: Generate ECFP4 fingerprints and 3D pharmacophore maps for the lead.
- Set Similarity Constraints: Define a minimum Tanimoto similarity of 0.7 to the lead's ECFP4 fingerprint.
- Build Virtual Library: Generate a library of analogs using reaction-based enumeration, ensuring all structures pass the initial similarity filter.
- Score & Rank: Apply the MPO scoring function (e.g., 40% potency prediction, 40% similarity, 20% synthetic accessibility) to rank library members.
- Iterate: Select the top 50 candidates for the next round of design, slightly relaxing similarity if diversity is too low.
Protocol 2: Tuning Constraint Stringency in an Active Learning Loop
- Initial Generation: Produce Generation 1 (G1) of compounds using a moderate similarity constraint (Tanimoto = 0.75).
- Test & Analyze: Synthesize and test a representative subset of G1 (e.g., 20 compounds). Plot property vs. similarity.
- Adjust: If the best performers are clustered at a similarity of ~0.7, formally relax the constraint to that value for Generation 2 (G2).
- Converge: Repeat until performance plateaus or similarity drifts beyond an acceptable absolute minimum (e.g., 0.55).
Data Presentation
Table 1: Impact of Similarity Threshold on Optimization Campaign Outcomes
| Tanimoto Similarity Constraint | Avg. Potency Gain (pIC50) | % Compounds Passing ADMET Filters | Structural Diversity (Avg. Pairwise Td) | Synthetic Success Rate |
|---|---|---|---|---|
| High (>0.85) | +0.3 (±0.2) | 95% | 0.15 (±0.05) | 90% |
| Moderate (0.70-0.75) | +1.1 (±0.4) | 80% | 0.35 (±0.10) | 75% |
| Low (<0.60) | +1.5 (±0.7) | 60% | 0.60 (±0.15) | 50% |
Table 2: Comparison of Molecular Fingerprints for Similarity-Guided Optimization
| Fingerprint Type | Calculation Speed | 3D Sensitivity | Performance in Scaffold Hopping | Recommended Use Case |
|---|---|---|---|---|
| MACCS Keys | Very Fast | Low | Poor | Initial, high-throughput pre-screening |
| ECFP4 | Fast | Medium | Good | Standard SGO constraint definition |
| ECFP6 | Medium | High | Excellent | Detailed SAR analysis |
| Pharmacophore | Slow | Very High | Moderate | Final-stage, pose-dependent optimization |
Visualizations
Title: SGO Iterative Campaign Workflow
Title: Similarity Constraint Trade-Off Space
The Scientist's Toolkit: Key Research Reagent Solutions
Table 3: Essential Resources for Similarity-Guided Optimization Campaigns
| Item/Category | Specific Example/Supplier | Function in SGO |
|---|---|---|
| Cheminformatics Software | RDKit (Open Source), Schrödinger Canvas | Generation of molecular descriptors (fingerprints, physicochemical properties), similarity calculations, and library enumeration. |
| Multi-Parameter Optimization (MPO) Tool | Dotmatics Vortex, Pipeline Pilot | Enables creation and visualization of custom scoring functions that combine similarity, potency, and ADMET predictions. |
| Virtual Screening Suite | OpenEye FRED, Cresset Blaze | Performs shape- and electrostatics-based similarity searches and 3D docking to validate constraints in a structural context. |
| ADMET Prediction Platform | Simulations Plus ADMET Predictor, StarDrop | Provides in silico predictions for permeability, metabolic stability, and toxicity to balance against similarity constraints. |
| Commercial Compound Library | Enamine REAL Space, WuXi GalaXi | Provides access to vast, synthesizable virtual compounds for enumeration and filtering within similarity boundaries. |
| Automated Synthesis Planner | ChemAxon ASKCOS, IBM RXN for Chemistry | Evaluates and prioritizes synthetic routes for top-ranked virtual compounds to ensure feasibility. |
Technical Support & Troubleshooting Center
This support center addresses common issues encountered when using molecular similarity constraints to guide bioisosteric replacements in scaffold hopping.
Frequently Asked Questions (FAQs)
Q1: My bioisosteric replacement, despite high 2D similarity, leads to a complete loss of activity. What went wrong? A: High 2D similarity (e.g., Tanimoto coefficient >0.7) does not guarantee conserved 3D pharmacophore geometry or electronic properties. This failure often stems from a stealth parameter mismatch.
- Troubleshooting Guide:
- Verify 3D Alignment: Superimpose the new scaffold core onto the original using shape-based alignment (e.g., ROCS). Check if key hydrogen bond donors/acceptors are >1.0 Å from their original vectors.
- Analyze Electrostatic Potential Maps: Compare the molecular electrostatic potential (MESP) surfaces of both scaffolds. A significant difference in local potential near the binding site vector can explain activity loss.
- Check Conformational Strain: Calculate the strain energy (e.g., using MMFF94) of the bioactive conformation of the new scaffold. Strain energy >5-7 kcal/mol can destabilize the bound conformation.
Q2: How do I choose the optimal similarity metric (2D vs. 3D) to constrain my scaffold hop? A: The choice is target- and binding-site dependent. Use the following decision table:
| Similarity Metric | Best Use Case | Typical Constraint Threshold | Risk if Misapplied |
|---|---|---|---|
| 2D Fingerprint (e.g., ECFP4) | High-throughput virtual screening, conserving gross substituent patterns. | Tanimoto: 0.3 - 0.5 for broad hops. | Missing critical 3D geometry. |
| 3D Shape/Pharmacophore (e.g., ROCS) | Binding mode conservation, where shape complementarity is key. | TanimotoCombo: >1.2 (Shape+Color). | Overly restrictive, missing innovative chemotypes. |
| Electrostatic/Quantum (e.g., MQN, ESP) | Targets where ionic or dipole interactions are critical (e.g., kinases). | Cosine Similarity: >0.8. | Computationally expensive, sensitive to tautomerization. |
Q3: My new scaffold has acceptable similarity scores and potency, but LogP increased dramatically, harming ADMET. How can similarity constraints prevent this? A: This is a common pitfall. Similarity constraints must be multi-dimensional.
- Protocol: Multi-Parameter Constrained Hop:
- Define a Combined Objective Function:
Score = α * Sim(Pharmacophore) + β * Potency(Predicted) + γ * Penalty(ΔLogP). - Set penalty
γto activate when|ΔLogP| > 0.5from the lead. - Use a
descriptor similarity constraint(e.g., on MQNs) alongside the primary scaffold similarity to maintain overall property space. This "similarity fence" keeps replacements within a defined chemical space.
- Define a Combined Objective Function:
Q4: The database search for bioisosteric replacements returns very few or no viable candidates. How can I expand the search effectively? A: This indicates your initial similarity constraints are too narrow.
- Step-by-Step Solution:
- Iteratively Relax Constraints: First, reduce the 3D shape similarity threshold by 0.1 increments. If unsuccessful, switch to a 2D graph-based similarity metric.
- Use a Replacement Fragment Library: Query a dedicated bioisosteric database (e.g., ChEMBL Bioisosteric Replacements, BROOD) with your core fragment, not the entire molecule.
- Apply a
scaffold-treehierarchy: Search for replacements to the parent scaffold (one level up in the scaffold tree) rather than the exact core.
Experimental Protocol: Validating a Bioisosteric Hop
Protocol Title: Integrated Computational/Experimental Validation of a Scaffold Hop. Objective: To confirm that a bioisosteric replacement proposed by similarity-guided design maintains the intended binding mode and biological activity.
Materials & Reagents (The Scientist's Toolkit):
| Research Reagent / Tool | Function / Purpose |
|---|---|
| Lead Compound & Proposed Hop | The original molecule and its bioisosteric replacement for comparison. |
| Target Protein (Purified) | For experimental binding and activity assays. |
| Molecular Dynamics (MD) Simulation Software (e.g., GROMACS) | To assess the stability of the new scaffold in the binding site over time. |
| Surface Plasmon Resonance (SPR) or ITC Assay Kit | To measure binding affinity (KD) and thermodynamics (ΔH, ΔS). |
| Cellular Functional Assay Kit | To measure efficacy (e.g., IC50) in a relevant phenotypic or pathway assay. |
| LC-MS/MS System | For analytical chemistry validation of compound purity and stability. |
Methodology:
- Computational Pre-validation:
- Perform shape-based alignment and calculate 3D similarity scores.
- Run a short MD simulation (50-100 ns) of each compound in the solvated protein binding pocket. Monitor root-mean-square deviation (RMSD) of the ligand pose.
- Synthetic Chemistry:
- Synthesize or procure the proposed bioisosteric compound. Confirm structure and purity (>95%) via NMR and LC-MS.
- Biophysical Binding Assay:
- Using SPR, titrate the new compound against immobilized target. Fit data to a 1:1 binding model to determine KD. Compare to lead.
- Functional Activity Assay:
- In a cell-based assay (e.g., reporter gene, enzyme activity), generate a dose-response curve. Calculate IC50/EC50.
- Data Integration:
- Correlate similarity scores (2D, 3D) with the experimental ΔpKD and ΔpIC50. Successful hops typically show <1 log unit loss in potency.
Workflow & Relationship Diagrams
Diagram Title: Scaffold Hopping with Similarity Constraints Workflow
Diagram Title: Thesis Context: Similarity Constraint Optimization
Troubleshooting Guides & FAQs
Q1: During a parallel optimization campaign, we observed a significant drop in target binding affinity (pIC50 decrease >1.0) despite maintaining a high Tanimoto similarity (>0.85) to the lead. What are the most common culprits?
A: This "similarity cliff" is a frequent issue. The core similarity metric (often fingerprint-based) may not capture critical, subtle stereoelectronic features. Troubleshoot using this protocol:
- Perform a conformational overlay: Use software (e.g., ROCS, MOE) to align the new analog and lead in their bioactive poses. Check for conservation of key hydrogen bond donors/acceptors and their vectors.
- Analyze electrostatic potential maps: Calculate and compare molecular electrostatic potential (MEP) surfaces. A localized change in charge distribution, even in a similar scaffold, can disrupt key ionic or dipole interactions.
- Check for introduced steric clashes: In the binding site model, identify if the new substituent, though chemically similar, causes a van der Waals clash with a protein residue.
Q2: Our optimized compound series shows excellent in vitro potency but consistently fails due to poor aqueous solubility (<10 µg/mL). How can we modify the scaffold to improve solubility without breaking similarity constraints?
A: This requires strategic, minimal perturbations. Follow this iterative protocol:
- Identify "hot spots" for modification: Use a matched molecular pair analysis on your series to identify specific positions where changes most affect solubility. Focus on R-groups not involved in direct target binding.
- Apply isosteric replacements: Replace a lipophilic group (e.g., phenyl) with a bioisostere that improves solubility (e.g., pyridyl, tetrahydro-2H-pyran) while maintaining volume and shape. See Table 1.
- Introduce a minimal, ionizable group: At a solvent-exposed position, consider adding a basic amine (e.g., morpholine) or acidic carboxylic acid. Use pKa prediction to ensure the group is partially charged at physiological pH.
- Re-evaluate similarity: Calculate similarity using a fingerprint method weighted for the pharmacophore (e.g., FCFP4) rather than pure topology (ECFP4) to ensure core constraints are met.
Q3: When optimizing for reduced CYP3A4 inhibition, we inadvertently increased hERG blockade. Are these properties linked, and what is a systematic approach to decouple them?
A: Yes, they are often linked via shared molecular features (basic amines, lipophilic aromatics). Use this parallel optimization workflow:
- Generate a diagnostic PLS model: Build a simple Partial Least Squares model from your current data with descriptors like pKa(basic), cLogP, and polar surface area (PSA) to predict both CYP3A4 and hERG liabilities.
- Define a allowed property space: From the model, define the optimal ranges (e.g., PSA >75 Ų, pKa <8.5, cLogP <4) that minimize both risks.
- Use a focused library design: Generate analogs using a reactant library filtered by these property ranges. Synthesize and test a small set (10-15) in parallel for both CYP3A4 and hERG inhibition early in the cycle.
Q4: What computational filters should be applied before synthesis in a parallel optimization loop to prioritize compounds with a higher probability of acceptable ADMET profiles?
A: Implement a tiered filtering protocol before compound selection for synthesis:
- Tier 1 (Structural Alerts): Run compounds through a rule-based filter (e.g., PAINS, Brenk alerts) to remove motifs prone to promiscuity or reactivity.
- Tier 2 (Property-Based): Apply the following hard filters derived from historical project data and literature:
| Parameter | Optimal Range | Rationale |
|---|---|---|
| Molecular Weight (MW) | ≤ 450 Da | Favors oral absorption and permeability. |
| cLogP | 1 - 3 | Balances solubility and permeability, reduces promiscuity risk. |
| Topological Polar Surface Area (TPSA) | 60 - 100 Ų | Indicator for passive cellular permeability and blood-brain barrier penetration. |
| Number of H-bond Donors (HBD) | ≤ 3 | Improves permeability and reduces metabolic clearance. |
| Number of Rotatable Bonds (NRot) | ≤ 7 | Favors oral bioavailability; reduces conformational flexibility. |
| Predicted hERG pIC50 | < 5.0 | Minimizes cardiac toxicity risk. |
- Tier 3 (Similarity Check): Ensure the compound passes the project-specific Tanimoto similarity threshold (e.g., ECFP4 > 0.7) to the designated lead.
Experimental Protocols
Protocol 1: Parallel Metabolic Stability Assay (Human Liver Microsomes)
Purpose: To rapidly rank compounds by intrinsic clearance (CLint) in a single batch.
- Incubation: Prepare 1 µM compound in 0.1 mg/mL HLM suspension (in 100 mM phosphate buffer, pH 7.4). Pre-incubate at 37°C for 5 min.
- Reaction Initiation: Start reaction by adding NADPH regenerating system (1mM final NADP+, 3mM glucose-6-phosphate, 1 U/mL G6P dehydrogenase). Final incubation volume: 100 µL.
- Time Points: Aliquot 15 µL at t = 0, 5, 10, 20, and 30 minutes into a plate containing 60 µL of stop solution (acetonitrile with internal standard).
- Analysis: Centrifuge, dilute supernatant, and analyze via LC-MS/MS. Quantify parent compound depletion.
- Calculation: Plot Ln(peak area ratio) vs. time. Slope = -k (elimination rate constant). Calculate CLint = k / [HLM protein concentration].
Protocol 2: High-Throughput Parallel Caco-2 Permeability Assay
Purpose: To assess intestinal permeability (Papp) for a library of analogs in a 96-well format.
- Cell Culture: Seed Caco-2 cells at high density (100,000 cells/well) on 96-well transwell plates. Culture for 21 days to ensure full differentiation and tight junction formation.
- Assay Day: Wash cell monolayers with transport buffer (HBSS, pH 7.4). Check monolayer integrity via transepithelial electrical resistance (TEER > 300 Ω*cm²).
- Dosing: Add 5 µM compound solution in buffer to the donor compartment (apical for A>B, basolateral for B>A). Receiver compartment contains blank buffer.
- Sampling: Take 50 µL from the receiver compartment at t=0 and t=90 min, and from the donor at t=90 min. Replace with fresh buffer.
- Analysis: Quantify compound in all samples by LC-MS/MS.
- Calculation: Calculate apparent permeability (Papp) using the formula: Papp (cm/s) = (dQ/dt) / (A * C0), where dQ/dt is the transport rate, A is the membrane area, and C0 is the initial donor concentration.
Visualizations
The Scientist's Toolkit: Key Research Reagent Solutions
| Item | Function & Rationale |
|---|---|
| Recombinant CYP Isozymes (3A4, 2D6, 2C9) | Individual cytochrome P450 enzymes for definitive identification of metabolic pathways and inhibition potential. |
| Cryopreserved Hepatocytes (Human) | Gold-standard cell system for predicting intrinsic clearance, metabolite identification, and enzyme induction. |
| MDCK-II or LLC-PK1 Cells | Alternative, faster-growing cell lines for medium-throughput permeability screening compared to Caco-2. |
| Phospholipid Vesicles (PAMPA) | Artificial membranes for high-throughput, cell-free assessment of passive transcellular permeability. |
| hERG-Expressed Cell Line (e.g., HEK293) | Stable cell line for reliable, high-throughput screening of compounds for potassium channel blockade liability. |
| Ready-to-Use NADPH Regenerating System | Pre-mixed solution of NADP+, G6P, and enzyme for consistent initiation of microsomal incubations. |
| LC-MS/MS with Automated Sample Handler | Essential for quantifying parent drug and metabolites in high-throughput ADMET assay samples. |
| Chemical Fragments for Solubility | A curated set of polar, ionizable fragments (e.g., morpholine, piperazine, carboxylic acids) for library design. |
Leveraging Matched Molecular Pairs (MMP) Analysis for Informed Structural Changes
Technical Support & Troubleshooting Center
FAQs
Q1: What defines a valid Matched Molecular Pair (MMP) in my dataset? A: An MMP is defined as two molecules that differ only by a single, well-defined structural change at a single site (e.g., -Cl to -OCH3). A common issue is incorrect fragmentation leading to "transformation noise." Ensure your algorithm settings (e.g., maximum cut bonds, ignoring certain atoms) are calibrated for your chemical space. Invalid pairs often arise from changes in core scaffolds or multiple, disconnected modifications.
Q2: My MMP analysis yields very few pairs from my compound library. How can I increase the yield? A: Low yield is typically due to overly strict constraints.
- Troubleshooting Steps:
- Adjust Fragmentation Parameters: Increase the maximum number of cut bonds (e.g., from default 5 to 8-10). This allows larger, more complex transformations to be identified.
- Check Pre-filtering: Ensure your initial similarity threshold (e.g., Tanimoto coefficient) is not too high. A value of 0.5-0.7 is often more productive than >0.8 for generating pairs.
- Review Chemistry: Library design may be the issue. Highly diverse scaffolds inherently produce fewer MMPs.
Q3: How do I handle noisy or contradictory activity data when analyzing MMP transformations? A: Statistical significance is key for noisy data.
- Protocol:
- Aggregate Data: Pool all instances of the same chemical transformation from your dataset.
- Calculate Statistics: For each transformation, compute the mean ΔActivity (ΔpIC50, ΔLogD, etc.), standard deviation, and number of observations (N).
- Apply Filters: Discard transformations where N < 5 or the standard deviation exceeds a threshold (e.g., >1.0 log unit for potency). Use confidence intervals (e.g., 95% CI) to rank transformation reliability.
Q4: My MMP-derived structural change improves potency but disastrously impacts solubility. How can MMP analysis predict this? A: MMP analysis must be multi-parameter. Isolated potency analysis is insufficient.
- Solution: Perform parallel MMP analyses on all key ADMET and physicochemical properties. A transformation should be evaluated across a property profile matrix. The table below illustrates a critical check.
Table 1: Evaluating a Hypothetical -H to -CF3 Transformation Profile
| Property | Mean Δ (CF3 - H) | N (Pairs) | Std Dev | Recommended Action |
|---|---|---|---|---|
| pIC50 | +0.82 | 45 | 0.35 | Positive |
| LogD | +0.75 | 42 | 0.20 | Flag: May reduce solubility |
| CLint (µL/min/mg) | +55 | 15 | 22 | Flag: May increase metabolic clearance |
| hERG pIC50 | +0.30 | 28 | 0.50 | Monitor |
Q5: How can I integrate MMP analysis with my existing QSAR or machine learning workflow? A: Use MMPs as a constraint or feature generation step.
- Integration Protocol:
- Generate Transformations: Run MMP analysis on your full historical compound set.
- Create Transformation Rules: Encode the highest-confidence, most beneficial transformations (e.g., -CH3 to -CONH2 for solubility) into a "rule library."
- Apply as a Filter: In a generative AI or design cycle, prioritize or reward structures that contain these validated, high-performing transformations.
- Feature Engineering: Use the presence/absence or counts of specific transformations from this library as additional input features for predictive models.
Key Experimental Protocol: Conducting an MMP Analysis for Lead Optimization
Objective: To systematically identify and evaluate single-point structural changes that optimize potency while maintaining favorable ADMET properties.
Materials & Reagents (The Scientist's Toolkit):
Table 2: Essential Research Reagent Solutions for MMP Analysis
| Item | Function & Rationale |
|---|---|
| Curated Structure-Activity Relationship (SAR) Database | Clean, annotated dataset of compounds with associated biological and physicochemical data. The foundational input. |
| MMP Fragmentation Software (e.g., RDKit, OpenEye, Cresset) | Algorithmic tool to systematically cleave molecules into constant/core and variable/transformation parts. |
| Cheminformatics Toolkit (e.g., KNIME, Pipeline Pilot, Python/R SDKs) | Platform for data manipulation, statistical analysis, and visualization of transformation trends. |
| Statistical Analysis Package | To compute mean property shifts, confidence intervals, and significance (p-values) for each transformation. |
| Data Visualization Software | To create transformation maps and property-shift scatter plots for clear communication of results. |
Methodology:
- Data Preparation: Assayemble a clean dataset of molecular structures (SMILES or SDF) with corresponding experimental data (e.g., pIC50, LogD, microsomal stability).
- Molecular Standardization: Apply consistent standardization (tautomer, charge, isotope handling) using your cheminformatics toolkit to ensure valid comparisons.
- Pair Generation & Fragmentation:
- Calculate pairwise molecular similarities (Tanimoto on Morgan fingerprints).
- Select pairs above a similarity threshold (e.g., 0.6).
- Apply the MMP fragmentation algorithm to these pairs to identify the single, localized transformation.
- Transformation Aggregation & Statistics:
- Group all pairs sharing the identical chemical transformation.
- For each property, calculate the mean change (Δ), standard deviation, and count (N) for each transformation group.
- Filtering & Prioritization:
- Filter out transformations with low counts (N < 3-5) or very high variance.
- Prioritize transformations that show a consistent, significant improvement in the primary target (e.g., ΔpIC50 > 0.3) with neutral or positive effects on key secondary properties (see Table 1).
- Application & Design: Use the prioritized list of validated transformations to guide the synthesis of new compounds in the next design cycle.
Visualizations
MMP Analysis Core Workflow
Integrating MMP Rules with Generative AI
Integrating Similarity Constraints with Multi-Parameter Optimization (MPO) Scores
FAQs and Troubleshooting Guides
Q1: During the integration of Tanimoto similarity constraints into my MPO desirability function, my compound set diversity collapses. All top-scoring compounds are structurally identical. What is the issue? A1: This is typically caused by an incorrect weighting balance. The similarity constraint term is likely overpowering all other parameters (e.g., potency, solubility, metabolic stability) in the composite MPO score. The algorithm is simply maximizing similarity to the reference, ignoring other critical properties.
- Troubleshooting Steps:
- Check Weighting Factors: Systematically reduce the weight (scaling factor, w_sim) applied to the similarity term in your MPO equation. A common starting point is to set it so the similarity term contributes 20-30% of the total possible score.
- Use a Non-Linear Transform: Apply a sigmoidal or Gaussian transform to the similarity score within the desirability function. This creates a "sweet spot" where compounds within a desired similarity range (e.g., 0.6-0.8 Tanimoto) are rewarded, but those exceeding it are not additionally penalized, allowing other parameters to influence the ranking.
- Validate with Pareto Front Analysis: Plot your compounds in a 2D space: Similarity Score vs. a combined score of other MPO parameters. Visually inspect if your current MPO weighting selects compounds on the Pareto front, representing the optimal trade-off.
Q2: My MPO-scoring function with a similarity constraint fails to suggest any viable compounds. All candidates either fail the similarity filter or have poor property scores. How can I broaden the search? A2: This indicates your similarity constraint threshold may be too strict or your chemical search space is insufficient.
- Troubleshooting Steps:
- Iteratively Relax Constraints: Gradually lower the minimum acceptable similarity threshold in your MPO function. Monitor how the property profiles (e.g., logD, clearance) of the passing compounds change with each iteration.
- Employ Scaffold Hopping Metrics: Integrate a scaffold-based similarity metric (e.g., Bemis-Murcko scaffold comparison) alongside the fingerprint-based Tanimoto score. This can be added as a secondary, lower-weighted term to encourage exploration of novel core structures that retain key interaction features.
- Expand the Virtual Library: Revisit your virtual library design. Ensure you are using diverse, well-curated reactant sets and robust reaction rules to generate a more comprehensive and synthetically accessible chemical space for the MPO algorithm to explore.
Q3: I observe high computational latency when running MPO optimization with a real-time similarity search against a large corporate database. How can I improve performance? A3: The bottleneck is the repetitive, full-database similarity calculation for each candidate during MPO scoring.
- Troubleshooting Steps:
- Pre-Compute and Index: Pre-compute molecular fingerprints for your entire reference database and store them in an indexed format optimized for similarity search (e.g., using a ball tree or locality-sensitive hashing libraries).
- Implement a Caching Layer: Cache the similarity scores for frequently encountered substructures or common molecular queries to avoid redundant calculations.
- Two-Stage Filtering: Implement a workflow where a fast, lower-dimensional similarity filter (e.g., MACCS keys) is applied first to remove distant compounds, followed by the more accurate, high-dimensional fingerprint (e.g., ECFP6) calculation only on the pre-filtered subset for the final MPO score.
Data Presentation
Table 1: Comparison of MPO Scoring Strategies with and without Integrated Similarity Constraints
| Scoring Strategy | Avg. MPO Score (Top 100) | Avg. Tc to Lead | Avg. cLogP | Avg. Predicted CL (Human) | Synthetically Accessibility (SAscore) |
|---|---|---|---|---|---|
| MPO Only (No Similarity) | 8.7 | 0.35 | 4.2 | 12 µL/min/mg | 3.2 |
| MPO + Hard Similarity Filter (Tc > 0.7) | 6.1 | 0.72 | 3.8 | 18 µL/min/mg | 2.8 |
| MPO + Weighted Similarity Term (w=0.3) | 8.4 | 0.65 | 3.9 | 15 µL/min/mg | 3.0 |
| MPO + Sigmoidal Similarity Transform | 8.5 | 0.58 | 3.7 | 14 µL/min/mg | 3.1 |
Experimental Protocols
Protocol: Evaluating Integrated MPO-Similarity Functions in a Lead Optimization Campaign Objective: To identify compounds balancing target potency, ADMET properties, and structural novelty relative to a known lead (Lead-A). Materials: See "The Scientist's Toolkit" below. Methodology:
- Compound Library Preparation: Generate a virtual library of ~50,000 analogs using enumerated reactions from commercially available building blocks around the core scaffold of Lead-A.
- Descriptor Calculation: For all library compounds and Lead-A, calculate: a) ECFP6 fingerprints, b) Key molecular descriptors (cLogP, TPSA, HBD/HBA), c) Predictive ADMET scores (CYP inhibition, metabolic clearance, permeability).
- MPO Function Design: Construct four parallel MPO functions:
- F1: Base MPO (Potency, cLogP, TPSA, Clearance).
- F2: F1 + Hard Tanimoto similarity (Tc) filter (Tc to Lead-A ≥ 0.65).
- F3: F1 + Linear Similarity Term:
MPO_Total = (0.7 * MPO_Base) + (0.3 * Tc). - F4: F1 + Sigmoidal Similarity Transform:
S_Desirability = 1 / (1 + exp(-k*(Tc - T0)))where k=10, T0=0.6.
- Scoring & Ranking: Apply each MPO function (F1-F4) to the virtual library. For each, rank compounds and select the top 100.
- Analysis: For each top-100 set, compute the averages shown in Table 1. Visually inspect chemical diversity via a t-SNE plot based on ECFP6 fingerprints.
Mandatory Visualization
Title: MPO-Similarity Optimization Workflow
Title: MPO-Similarity Score Integration Logic
The Scientist's Toolkit: Research Reagent Solutions
Table 2: Essential Materials for MPO-Driven Similarity Optimization Experiments
| Item | Function in the Experiment |
|---|---|
| Cheminformatics Software (e.g., RDKit, Schrödinger Canvas) | Used for molecular fingerprint generation (ECFP6), descriptor calculation (cLogP, TPSA), and Tanimoto similarity computation. The core engine for similarity assessment. |
| ADMET Prediction Platform (e.g., StarDrop, ADMET Predictor) | Provides high-throughput in silico predictions for key MPO parameters: metabolic stability, cytochrome P450 inhibition, permeability, and solubility. |
| Virtual Library Enumeration Tool (e.g., ChemAxon Reactor, KNIME) | Generates the searchable chemical space from defined reactions and building block libraries, enabling scaffold exploration around the lead. |
| Multi-Parameter Optimization Software (e.g., Schrӧdinger's Compound Design, SeeSAR) | Allows the construction, testing, and visualization of custom MPO scoring functions that incorporate weighted similarity terms and desirability functions. |
| Corporate Compound Database | The repository of known structures (historical leads, competitor compounds) used as the reference set for calculating similarity constraints during optimization. |
Navigating Pitfalls: Solving the Activity Cliffs and Similarity Traps
Identifying and Escaping Local Minima in Chemical Space
This technical support center addresses common challenges in lead optimization, specifically framed within the thesis context of optimizing molecular similarity constraints to escape unproductive regions of chemical space.
Troubleshooting Guides & FAQs
Q1: Our SAR series has stalled; all new analogs show similar, suboptimal potency despite significant structural changes. Are we in a local minima? A: This is a classic symptom. You may be confined by overly strict similarity constraints. Perform the following diagnostic:
- Calculate the property space (e.g., using PCA on a set of physicochemical descriptors) of your last 20 synthesized compounds.
- If the Euclidean distance in this property space is below your similarity threshold (e.g., Tanimoto > 0.7), you are likely in a local minimum.
- Protocol - Similarity Constraint Relaxation:
- Step 1: Select your current best compound (the apparent minima).
- Step 2: Using your chosen cheminformatics suite (e.g., RDKit), generate a virtual library with two filters:
- Filter A: Tanimoto similarity (ECFP4) >= 0.4 and <= 0.65 to the lead.
- Filter B: At least one new functional group or ring system not present in the last 20 compounds.
- Step 3: Score and rank this library using your primary predictive model (e.g., QSAR model for potency).
- Step 4: Synthesize and test the top 5-10 compounds from this broader similarity region.
Q2: How do we balance escaping a minima with maintaining favorable ADMET properties we've worked hard to achieve? A: Implement a multi-objective scoring protocol with constrained optimization.
- Define your objectives (e.g., pIC50, LogD, solubility, hERG score).
- Define hard constraints for properties that must be preserved (e.g., LogD must remain between 2.0 and 4.0).
- Use an algorithm (e.g., NSGA-II) to navigate the Pareto front, exploring compounds that may sacrifice minor similarity for gains in potency.
Q4: What computational strategies can proactively prevent getting stuck? A: Integrate basin-hopping or meta-dynamics sampling into your design cycle.
- Protocol - Iterative Broadening Search:
- Start with a defined similarity constraint (e.g., ECFP4 Tanimoto ≥ 0.7).
- After each design-make-test cycle with no significant improvement (>0.5 log unit), reduce the similarity constraint by 0.1.
- Introduce a "novelty penalty" in your scoring function to prioritize scaffolds not yet explored in the campaign.
Table 1: Impact of Similarity Threshold on Escape from a Known Local Minima
| Similarity Constraint (ECFP4 Tanimoto Min) | % of Proposed Library Escaping Minima* | Avg. Potency Gain (pIC50 Δ) | Avg. LogD Change |
|---|---|---|---|
| ≥ 0.8 | 2% | +0.1 | +0.05 |
| ≥ 0.6 | 25% | +0.8 | +0.3 |
| ≥ 0.4 | 68% | +1.5 | +0.9 |
| No Constraint | 100% | +2.1 | +2.5 |
*Defined as >2.0 log units improvement over the stalled lead compound in a benchmark dataset.
Table 2: Performance of Sampling Algorithms in a Simulated Chemical Space
| Algorithm | Iterations to Find Global Minima* | Computational Cost (Relative CPU hrs) | Diversity of Solutions (Avg Pairwise Td) |
|---|---|---|---|
| Greedy Similarity Search | Did not escape | 10 | 0.15 |
| Genetic Algorithm | 45 | 85 | 0.52 |
| Basin-Hopping Monte Carlo | 22 | 110 | 0.61 |
| Particle Swarm Optimization | 31 | 75 | 0.48 |
*Starting from a defined local minima in a published benchmark function.
Experimental Protocols
Protocol: Free Energy Perturbation (FEP) Guided Escape Purpose: To rationally design escape paths by computationally evaluating the binding energy of diverse analogs without synthesis. Methodology:
- Anchor Point: Start from your current lead compound (L) in its protein-bound conformation (from crystal structure or MD).
- Define Perturbations: Generate a set of core modifications (e.g., ring opening/scission, linker length changes, hinge fragment replacement).
- Run FEP Calculations: Use a validated FEP pipeline (e.g., Schrodinger FEP+, OpenFE) to calculate the relative binding free energy (ΔΔG) for transforming L into each proposed analog (A).
- Prioritization: Synthesize and test compounds where ΔΔG_FEP predicts improvement (>1 kcal/mol favorable), even if 2D similarity is low.
Protocol: Orthogonal Screen for Conformational Selection Purpose: To identify new chemotypes that bind to the same target but via different interaction patterns. Methodology:
- Prepare a stabilized form of the target protein (e.g., via mutagenesis, fusion tags).
- Screen against a highly diverse, fragment-like library (MW < 250, LogP < 2.5) using SPR or thermal shift.
- For confirmed hits, determine co-crystal structures.
- Use the new binding motif as a seed for lead optimization, independent of your original chemical series.
Visualizations
Title: Decision Workflow for Suspected Local Minima
Title: Adaptive Optimization Cycle to Avoid Minima
The Scientist's Toolkit: Research Reagent Solutions
Table 3: Essential Materials for Minima Escape Experiments
| Item | Function & Rationale |
|---|---|
| Diverse Fragment Library (e.g., 5,000 cpds, MW <250) | Provides orthogonal chemical starting points to jump to new regions of chemical space via fragment-based screening. |
| Stabilized Target Protein (Mutant or Tagged) | Enables rigorous biophysical screening (SPR, ITC, X-ray) with diverse compounds under consistent conditions. |
| Free Energy Perturbation (FEP) Software (e.g., FEP+, OpenFE) | Computationally evaluates large, structurally diverse jumps with quantitative ΔΔG prediction, guiding synthesis. |
| Cheminformatics Suite with API (e.g., RDKit, Schrodinger) | Enables automated property calculation, similarity analysis, and virtual library generation with programmable constraints. |
| Multi-Parameter Optimization (MPO) Tool | Scores compounds by balancing potency, selectivity, ADMET, and novelty to navigate the Pareto frontier effectively. |
| Analog-Producing Chemistry Kit (e.g., parallel synthesis equipment) | Accelerates synthesis of proposed escape candidates, especially those requiring new or non-standard reactions. |
Troubleshooting Guide & FAQ
Q1: During SAR exploration, a single methyl group substitution led to a >100-fold potency loss. What are the primary computational checks to diagnose this activity cliff?
A1: Follow this diagnostic protocol:
- Conformational Analysis: Perform a constrained systematic search (e.g., using OpenEye's OMEGA or RDKit) to compare low-energy conformers of the active and inactive analog. Overlay using the maximum common substructure (MCS). A key torsion flip could disrupt binding.
- Electrostatic Potential Mapping: Calculate and compare molecular electrostatic potentials (MEPs) at the DFT B3LYP/6-31G* level. The added group may create a repulsive positive potential in a negative binding pocket.
- Ligand Strain Assessment: Execute a protein-ligand minimization (MMFF94 or similar) of the modified compound in the binding site (from a co-crystal or homology model). An internal energy increase > 5 kcal/mol suggests excessive strain upon binding.
Experimental Protocol: Conformational & Strain Analysis
- Software: Maestro (Schrödinger) or OpenEye Toolkits.
- Steps:
- Generate up to 20 low-energy conformers for each molecule within a 10 kcal/mol window.
- Align conformers via the MCS and calculate RMSD.
- Dock the most similar conformer into the target's binding site using Glide SP.
- Perform a constrained MM-GBSA minimization. The difference in MM-GBSA
deltaG_bindand ligand strain energy (E_minimized_ligand - E_isolated_ligand) flags steric clashes.
Q2: Our similarity searching (Tanimoto > 0.85) fails to predict cliffs. How should we augment our descriptor set?
A2: Relying solely on 2D fingerprints is insufficient. Implement a multi-descriptor similarity matrix.
Table 1: Descriptor Performance for Cliff Prediction
| Descriptor Class | Example Metric | Sensitivity to Cliffs | Recommended Threshold |
|---|---|---|---|
| 2D Structural | ECFP4 Fingerprint (Tanimoto) | Low | >0.85, but poor predictor |
| 3D Shape & Overlap | ROCS Tanimoto Combo | Moderate | >0.7 |
| Pharmacophore | Phase HypoScore | High | >0.5 |
| Quantum Chemical | HOMO/LUMO Eigenvalue Diff. | Very High | >0.3 eV |
Experimental Protocol: Multi-Descriptor Similarity Workflow
- Data Curation: Assay data (pIC50) for 50-100 close analogs.
- Descriptor Calculation: Use RDKit (2D), OpenEye ROCS (3D), and Gaussian (DFT HOMO/LUMO).
- Pairwise Analysis: For all compound pairs, calculate similarity for each descriptor in Table 1.
- Cliff Identification: Flag pairs where pIC50 difference > 2 (100-fold) for analysis.
Q3: What experimental assays are critical to validate a hypothesized steric clash causing a cliff?
A3: Move beyond biochemical potency to structural and biophysical assays.
Table 2: Key Validation Assays for Activity Cliffs
| Assay | What it Measures | Cliff Indicator |
|---|---|---|
| SPR/ITC | Binding affinity (Kd) and enthalpy (ΔH) | ΔΔH > 2 kcal/mol suggests lost key interaction. |
| X-ray Crystallography | Protein-ligand co-structure | Direct visualization of unfavorable contacts; B-factor spikes. |
| Thermal Shift (DSF) | Protein thermal stability (ΔTm) | ΔTm of cliff compound < ΔTm of active analog. |
| NMR Chemical Shift Perturbation | Binding-induced atom-level changes | Abnormal perturbation patterns near modification site. |
Experimental Protocol: ITC for Cliff Diagnosis
- Instrument: MicroCal PEAQ-ITC.
- Buffer: 25 mM HEPES, 150 mM NaCl, pH 7.4, 1% DMSO.
- Steps:
- Titrate 200 μM ligand into 20 μM protein solution.
- Run reference titrations (ligand into buffer).
- Fit data to a one-site binding model.
- Compare the cliff compound's enthalpic signature (ΔH) to the active analog. A dramatically less favorable ΔH confirms lost favorable interactions.
Diagram: Activity Cliff Diagnosis Workflow
The Scientist's Toolkit: Key Research Reagent Solutions
Table 3: Essential Materials for Activity Cliff Investigation
| Item | Function & Rationale |
|---|---|
| Stable, Purified Protein (>95%) | Essential for ITC, SPR, and crystallography. Ensures binding data is not an artifact of impurity or instability. |
| Crystallization Screen Kits (e.g., Hampton Research) | For obtaining structural snapshots of both active and cliff compounds to visualize the precise cause of potency loss. |
| High-Quality Chemical Probes | Cliff compound AND a closely related active analog (synthetic intermediates are ideal) for a controlled pairwise comparison. |
| Bioinert Detergents (e.g., CHAPS) | To maintain protein solubility during extended biophysical assays, especially with more hydrophobic cliff compounds. |
| Reference Standard Compound | A known potent inhibitor for assay validation and as a control in every experimental run to ensure system stability. |
Diagram: Lead Optimization with Similarity Constraints
Technical Support Center
Troubleshooting Guide & FAQs
Q1: Why does my candidate compound, designed with >95% Tanimoto similarity to the lead, show a complete loss of target binding affinity?
A: This is a classic symptom of over-constraining the similarity search. High 2D fingerprint similarity does not guarantee conserved binding mode. The loss may stem from a critical, overlooked 3D electrostatic or steric clash. First, verify the binding pose via molecular docking. Then, analyze the electrostatic potential surface (ESP) maps of both molecules. A small, unfavorable substituent in a tightly packed subpocket can cause disproportionate activity loss. We recommend relaxing the similarity constraint to 85-90% and focusing on pharmacophore feature conservation rather than overall fingerprint similarity.
Q2: How can I systematically explore chemical space outside my current similarity threshold without a blind, high-throughput screen?
A: Implement a "scaffold hop" protocol within a constrained property space. Use a core replacement or topology-based search (e.g., using cyclic system fingerprints) while holding key physicochemical properties (cLogP, MW, TPSA) constant. This balances novelty with drug-likeness. The workflow below details this method.
Experimental Protocol: Constrained Scaffold-Hopping for Novelty
- Define the Pharmacophore: From your lead complex crystal structure, identify 3-4 critical features (H-bond donor/acceptor, aromatic center, hydrophobic centroid).
- Set Property Constraints: Calculate the lead's properties. Set search boundaries: MW ± 100 Da, cLogP ± 1, TPSA ± 20 Ų.
- Database Search: Use a tool like RDKit or a commercial platform (e.g., SeeSAR, Spark) to search a database (e.g., Enamine REAL Space) for molecules matching the pharmacophore query.
- Apply Property Filters: Filter results from Step 3 using the constraints from Step 2.
- Diversity Selection: Cluster the remaining hits by ECFP4 fingerprints. Select up to 50 representatives from the top 5-10 largest clusters for in silico assessment.
- Priority Assessment: Score and rank selected hits using a consensus of docking score, interaction conservation, and synthetic accessibility (SAscore).
Q3: My project has a strict similarity mandate. What are the most sensitive computational metrics to detect "over-constraint" early?
A: Monitor these metrics during your series design. Significant deviations often signal over-constraint.
Table: Key Metrics to Detect Over-Constraint
| Metric | Calculation/Description | Warning Sign |
|---|---|---|
| 3D Shape Overlap (TanimotoCombo) | ROCS-based shape + color (feature) score. | High 2D similarity but low 3D Combo (<1.2). |
| Property Profile Deviation | PCA of 6+ ADME/Tox properties (e.g., cLogP, HBD, HBA). | All compounds cluster tightly in PC space with no diversity. |
| SAR Cliff Incidence | Frequency of small structural changes causing >100x potency loss. | High incidence (>10% of pairwise comparisons). |
| Synthetic Accessibility (SAscore) | Score from 1 (easy) to 10 (hard). | Average SAscore increases sharply with maintained similarity. |
Q4: We observed excellent potency but poor solubility in a strict similarity series. How can we break this correlation without violating the project's similarity rule?
A: This is a common pitfall. The rule likely uses a specific fingerprint (e.g., ECFP4). You can introduce "stealth" modifications that improve solubility but are fingerprint-neutral. Focus on bioisosteric replacements that alter key physicochemical properties without drastically changing the fingerprint pattern. Example: replace a phenyl ring with a pyridyl ring (improves solubility, similar size/H-bond count), or swap a -CH3 for -OCH3. Utilize matched molecular pair analysis to find such transformations proven to increase solubility.
Research Reagent Solutions Toolkit
Table: Essential Tools for Managing Similarity Constraints
| Item / Reagent | Provider / Tool Type | Function in Experiment |
|---|---|---|
| RDKit | Open-source cheminformatics | Core library for fingerprint generation, similarity calculation, and property filtering. |
| ROCS (Rapid Overlay of Chemical Structures) | OpenEye | Tool for 3D shape and feature-based alignment and similarity scoring. |
| SeeSAR | BioSolvelt | Interactive platform for visual, affinity-based ranking and quick property estimation during scaffold hopping. |
| Enamine REAL Space | Enamine | Ultra-large, readily synthesizable compound library for virtual screening and novelty exploration. |
| MATCHED MOLECULAR PAIRS (MMP) Databases | Commercial or in-house | Identify chemically meaningful, small structural transformations and their associated property changes. |
| Cresset FieldTemplater | Cresset | Generate consensus molecular fields and scaffolds to guide design beyond simple atom-based similarity. |
Visualizations
Diagram 1: Constrained Scaffold-Hopping Workflow
Diagram 2: Over-Constraint Detection & Response Pathway
Technical Support Center
Frequently Asked Questions (FAQs)
Q1: During the early-stage virtual screening, my candidate pool becomes too diverse when I lower the Tanimoto threshold. How can I maintain focus while exploring a reasonable chemical space? A1: A common solution is to implement a dynamic, stage-dependent threshold. For early-stage lead identification, use a broader similarity range (e.g., Tanimoto coefficient (Tc) 0.3–0.6) to foster scaffold diversity. Ensure your descriptor set is optimized for this stage, focusing on 2D fingerprints like ECFP4. The protocol below details this workflow.
Q2: In the lead optimization phase, how do I prevent analogs from becoming too similar, thus missing potential improvements? A2: This indicates a static, overly restrictive threshold. As you progress to lead optimization, the threshold's lower bound should be increased to maintain core pharmacophore integrity, while the upper bound must be actively managed to avoid "analog trap." Introduce a "similarity cap" (e.g., Tc < 0.85) to enforce meaningful structural variation within the series.
Q3: My computed similarity scores do not correlate well with the observed activity cliff. What could be wrong? A3: The issue likely lies in the chosen fingerprint or metric. Activity cliffs often arise from specific local interactions not captured by global fingerprints. Implement a hybrid similarity approach. Use a protocol that combines ECFP4 (global) with pharmacophore fingerprints or matched molecular pairs (MMP) analysis to highlight critical local differences.
Q4: What is the recommended method for empirically determining the optimal threshold range for a new project? A4: Conduct a retrospective analysis using known actives and inactives from your target class. Perform a similarity search with varying thresholds and plot the enrichment factor (EF) and scaffold recovery rate. The threshold range that maximizes early enrichment (EF1%) while recovering key scaffolds should be your starting point. See the experimental protocol for details.
Troubleshooting Guides
Issue: Poor Enrichment in Virtual Screening Despite "Optimized" Threshold
- Symptoms: High hit rate but very low confirmation rate in biochemical assays; retrieved compounds are structurally similar but pharmacologically irrelevant.
- Diagnosis: The similarity constraint is likely based on an inappropriate molecular representation, leading to false positives.
- Solution:
- Re-evaluate Descriptors: Switch from Morgan fingerprints (ECFP) to functional-class fingerprints (FCFP) or integrate 3D pharmacophore descriptors.
- Implement Multi-Parameter Similarity: Do not rely on a single Tc value. Use a weighted composite score: Similarity Score = (w1 * TcECFP4) + (w2 * TcPharmacophore) + (w3 * Shape_Tanimoto).
- Apply Dynamic Weighting: Early stage: w1 (ECFP) high, w3 (Shape) low. Optimization stage: Increase w2 and w3 to refine for precise interactions.
Issue: Analog Exhaustion in Late-Stage Optimization
- Symptoms: Iterative rounds of similarity-based search yield no new analogs with improved properties (PK/PD, toxicity).
- Diagnosis: The similarity threshold is static and too high, confining exploration to a local minima.
- Solution:
- Introduce a Directed Diversity Step: Periodically (e.g., every 3-4 cycles) expand the search using a deliberately lowered threshold (e.g., reduce min Tc by 0.15) for one generation to introduce novel chemotypes.
- Apply a Soft Penalty Function: In your objective function, penalize new candidates with Tc > 0.9 to the current lead, encouraging exploration of slightly more distant regions of chemical space.
- Switch to Bioisostere-Based Similarity: Use a similarity metric that recognizes validated bioisosteric replacements to jump to new, but functionally equivalent, scaffolds.
Data Presentation
Table 1: Recommended Dynamic Threshold Ranges by Optimization Stage
| Stage | Primary Goal | Recommended Tanimoto (ECFP4) Range | Key Metric to Optimize | Primary Fingerprint |
|---|---|---|---|---|
| Hit Identification | Maximize scaffold diversity | 0.30 – 0.65 | Scaffold Recovery Rate | ECFP4, FCFP4 |
| Lead Generation | Balance novelty & SAR | 0.55 – 0.75 | Enrichment Factor (EF1%) | ECFP4, Hybrid (2D/3D) |
| Lead Optimization | Refine specific properties | 0.70 – 0.85* | Potency & ADMET Profile | FCPF6, Pharmacophore, Shape |
| Late-Stage Optim. | Overcome specific liabilities | 0.65 – 0.80 (Bioisostere-aware) | In vitro & in vivo Efficacy | Matched Molecular Pairs |
*An upper cap of 0.85–0.90 is advised to avoid analog trap.
Table 2: Impact of Dynamic Thresholding on a Retrospective Kinase Inhibitor Project
| Threshold Strategy | Compounds Screened | Confirmed Hits | Unique Scaffolds Found | Avg. IC50 Improvement (nM) |
|---|---|---|---|---|
| Static (Tc > 0.7) | 5,000 | 12 | 2 | 1.5x |
| Dynamic (Stage-Based) | 5,000 | 31 | 7 | 4.2x |
| Static (Tc > 0.5) | 5,000 | 45 | 11 | 0.8x (poor potency) |
Experimental Protocols
Protocol 1: Establishing a Baseline Dynamic Threshold via Retrospective Enrichment Analysis Objective: To determine project-specific initial threshold ranges for hit identification and lead optimization. Materials: See "Research Reagent Solutions" table. Methodology:
- Dataset Curation: Compile a validated set of actives (A) and decoys (D) for your target (e.g., from DUD-E or ChEMBL).
- Fingerprint Generation: Generate ECFP4 fingerprints for all compounds using RDKit or a similar cheminformatics toolkit.
- Similarity Searches: For each active seed compound, perform a similarity search against the combined A+D set using a sliding threshold (Tc from 0.2 to 0.9 in 0.05 increments).
- Enrichment Calculation: At each threshold, calculate the Enrichment Factor at 1% (EF1%): EF1% = (Hitrate{sample} / Hitrate{total}). Hitrate{sample} is the fraction of actives found in the top 1% of the screened database.
- Scaffold Analysis: Cluster the retrieved actives at each threshold using Bemis-Murcko scaffolds. Count the number of unique scaffolds.
- Define Ranges: The Hit ID range is where EF1% remains >5 and unique scaffolds are maximized. The Lead Opt range is where EF1% peaks (often higher Tc) while maintaining ≥2 scaffolds.
Protocol 2: Implementing a Similarity-Capped Optimization Cycle Objective: To iteratively optimize a lead series while enforcing structural innovation. Methodology:
- Seed Selection: Start with your current lead compound (L).
- Database Query: Query a corporate or virtual library. Retrieve all compounds with Tc(ECFP4) to L between your defined lower bound (e.g., 0.70) and an upper cap (e.g., 0.87).
- Multi-Objective Ranking: Rank candidates by a composite score: Score = α * PredictedPotency + β * FavorableADMET_Property - γ * (Tc > 0.82). The penalty term γ discourages selection of extremely close analogs.
- Selection & Testing: Select top 20-50 compounds for synthesis and testing.
- Iterate & Adapt: With each cycle, if property gains plateau, temporarily lower the upper cap to 0.80 for one cycle to introduce diversity.
Diagrams
Dynamic Thresholding in Lead Optimization Workflow
Similarity Search Pipeline with Dynamic Filtering
The Scientist's Toolkit: Research Reagent Solutions
| Item/Category | Function & Relevance in Similarity Threshold Optimization |
|---|---|
| RDKit | Open-source cheminformatics toolkit for generating molecular fingerprints (ECFP, FCFP), calculating similarity metrics, and performing scaffold analysis. Essential for protocol development. |
| ChEMBL / DUD-E Databases | Public repositories of bioactive molecules and carefully curated decoys. Used for retrospective validation and calibration of threshold ranges for specific target classes. |
| KNIME or Pipeline Pilot | Workflow automation platforms. Enable the construction of reproducible, high-throughput similarity screening and analysis pipelines with visual parameter adjustment. |
| Matched Molecular Pair (MMP) Algorithms | Identify minimal, systematic structural changes between molecules. Critical for analyzing activity cliffs and defining bioisostere-aware similarity in late-stage optimization. |
| ROCS (Rapid Overlay of Chemical Structures) | Software for 3D shape and pharmacophore similarity searching. Provides an alternative or complementary similarity metric to 2D fingerprints, especially for lead optimization. |
| Custom Corporate Compound Library | The primary search space for lead optimization. Must be well-curated with standardized structures and annotated with available experimental data for machine learning models. |
Technical Support Center: Troubleshooting Guides & FAQs
FAQ: Why is my multi-target compound losing potency against my primary target when I optimize for selectivity?
Answer: This is often due to overly restrictive similarity constraints (e.g., a low Tanimoto coefficient threshold) applied to the core scaffold. This locks in features that are suboptimal for the primary target's binding pocket while you explore diversity for off-target avoidance. Solution: Implement a tiered similarity constraint strategy. Use a stricter threshold for the pharmacophore-bearing core region but allow more flexibility in peripheral substituents.
FAQ: My computational model predicts good selectivity, but my assay results show high cross-reactivity with an unexpected off-target. What went wrong?
Answer: The chemical similarity constraint likely forced the retention of features that are recognized by a related protein in the same family (e.g., a kinase hinge-binding motif). The model's training data may not have included this particular off-target.
Troubleshooting Protocol:
- Perform a structural bioinformatics check: Align the binding sites of your primary and unexpected off-target using PDB structures.
- Analyze the common substructure enforced by your similarity search. Map it onto the binding site alignment.
- Relax the constraint on the specific moiety interacting with the conserved region and explore bioisosteric replacements.
FAQ: How do I balance similarity (for lead-likeness) with the need for diverse chemical features to achieve selectivity?
Answer: Utilize multi-parameter optimization (MPO) scoring within a defined chemical space. Frame similarity not as a single global metric, but as a series of constraints on specific molecular features.
Experimental Protocol for Constraint-Based Library Design
Objective: Generate a focused library that maintains core target engagement while exploring selectivity-driving diversity.
Methodology:
- Define the reference compound (your lead molecule).
- Perform a pharmacophore analysis to identify essential interaction points (e.g., hydrogen bond donors/acceptors, aromatic rings).
- Generate a fragment-based decomposition of the lead.
- Apply differential similarity constraints:
- Core Fragment: High similarity constraint (Tanimoto ≥ 0.85 using ECFP4 fingerprints).
- Linker Region: Medium constraint (Tanimoto 0.5 - 0.7).
- Peripheral R-groups: Low constraint (Tanimoto < 0.4) to enable large, diverse commercial enumerations.
- Use a virtual screening workflow that filters enumerated compounds by these staged similarity metrics before docking into primary and off-target models.
Quantitative Data on Similarity Thresholds & Selectivity Outcomes
Table 1: Impact of Global Tanimoto Coefficient (TC) Threshold on Compound Library Profiles
| TC Threshold (vs. Lead) | Library Size (Compounds) | Avg. Potency (pIC50 Primary) | Avg. Selectivity Index (vs. Kinase X) | % Compounds Passing PAINS Filter |
|---|---|---|---|---|
| ≥ 0.90 | 850 | 7.2 ± 0.3 | 12 | 98 |
| ≥ 0.75 | 12,500 | 6.8 ± 0.6 | 45 | 91 |
| ≥ 0.60 | 95,000 | 6.1 ± 0.9 | 110 | 82 |
| No Constraint | >1,000,000 | 5.5 ± 1.2 | 25 | 65 |
Table 2: Performance of Tiered vs. Global Similarity Constraints in a Kinase Inhibitor Project
| Constraint Strategy | Compounds Screened | Hits (Primary Target) | Selective Hits (SI >50) | Optimized Lead Selectivity Index |
|---|---|---|---|---|
| Global (TC ≥ 0.80) | 5,000 | 15 | 1 | 30 |
| Tiered (Core TC ≥ 0.85, R-groups Diverse) | 5,000 | 22 | 7 | 120 |
Experimental Visualization
Title: Workflow for Tiered Similarity Constraint-Based Library Design
Title: Similarity-Selectivity Optimization Trade-off Relationship
The Scientist's Toolkit: Key Research Reagent Solutions
Table 3: Essential Materials for Managing Similarity & Selectivity Experiments
| Item | Function in Context | Example Vendor/Product (Illustrative) |
|---|---|---|
| Similarity Search Software | Enforces Tanimoto or Tversky constraints during virtual library enumeration and screening. | OpenEye ROCS, Cresset Forge, RDKit (Open Source) |
| Parallel Profiling Assay Kit | Enables experimental selectivity profiling against a panel of related off-targets (e.g., kinase, GPCR panels). | Eurofins DiscoverX ScanMax, Reaction Biology Kinase Panel |
| Crystallography Service | Provides structural data (protein-ligand co-crystals) to inform which parts of the lead are critical for binding and can be constrained. | Creative Biolabs, Thermo Fisher Scientific Services |
| Fragment Library | A set of small, diverse molecular fragments used to systematically replace parts of the lead while monitoring similarity metrics. | Enamine Fragment Space, Maybridge Fragment Library |
| Cheminformatics Database | A database with bioactivity annotations (e.g., ChEMBL) to assess the "privileged substructure" risk of a constrained core. | ChEMBL, GOSTAR |
| Multiparameter Optimization (MPO) Tool | Software to score and rank compounds based on a weighted function of similarity, predicted potency, selectivity, and ADMET. | Schrödinger's Canvas, DataWarrior |
Benchmarking Success: Validating and Comparing Similarity Strategies
Technical Support Center: Troubleshooting for Similarity-Constrained Lead Optimization
Frequently Asked Questions (FAQs)
Q1: My similarity-constrained scaffold hop is failing to generate novel chemotypes that are both synthetically tractable and potent. The algorithm gets stuck in local minima. What are the primary parameters to adjust? A: This is a common issue in multi-objective optimization. Prioritize adjusting the following parameters, often in this order:
- Constraint Weighting: Gradually relax the initial Tanimoto similarity constraint (e.g., from 0.7 to 0.5) in your objective function to allow for greater structural exploration.
- Diversity Seeding: Implement a diversity-penalty term or use a population-based algorithm (like NSGA-II) with an explicit diversity preservation mechanism.
- Step Size Control: Reduce the maximum allowed structural change per optimization cycle to prevent large, destabilizing leaps that lead to poor scoring compounds.
Q2: When using a matched molecular pair (MMP) analysis within a constrained optimization, how do I handle resultant compounds with improved predicted affinity but poor solubility or metabolic stability? A: This indicates a need for integrated multi-parameter optimization (MPO). Modify your protocol to:
- Incorporate Predictive Filters: Apply calculated property filters (e.g., LogP < 5, TPSA > 75 Ų) before the final scoring stage to eliminate unsuitable candidates.
- Use a Composite Score: Implement a weighted desirability function where the final score = (w1 * pKi) + (w2 * SolubilityScore) - (w3 * MetabolicLability_Score). Optimize against this composite.
- Post-Processing Analysis: Use the MMP analysis to identify transformations that specifically improve ADME properties, and apply these as corrective steps.
Q3: My 3D pharmacophore-constrained optimization generates molecules that satisfy the pharmacophore but have unrealistic strain or conformationally inaccessible poses. How can I validate and correct for this? A: This is a critical failure point. Implement the following validation protocol:
- Conformational Sampling: Perform a rigorous conformational analysis (e.g., using OMEGA or CREST) on the proposed molecule to generate a low-energy ensemble.
- Strain Energy Calculation: Calculate the molecule's strain energy (e.g., using MMFF94 or GFN2-xTB). Flag any candidate with an internal strain energy > 15 kcal/mol relative to a strain-minimized analog.
- Pose Validation: Dock the low-energy conformational ensemble into your target binding site. Accept only poses where the pharmacophore alignment is achieved by a conformation within 3 kcal/mol of the global minimum.
Q4: In a fingerprint-based similarity search (ECFP4), how do I determine the optimal similarity threshold to balance novelty and maintaining core activity? A: The optimal threshold is project-dependent but can be systematically determined through retrospective analysis. Follow this workflow:
- Generate a Validation Set: Curate a dataset of known actives and confirmed inactives for your target.
- Perform a Threshold Sweep: Calculate the enrichment factor (EF) at 1% and 5% of the screened database for a range of similarity thresholds (0.3 to 0.8).
- Select the Inflection Point: Choose the threshold just before the EF plateaus or drops significantly. Data from recent studies (see Table 1) suggest a typical "sweet spot" lies between 0.45 and 0.65 for meaningful scaffold hops.
Key Experimental Protocols
Protocol 1: Establishing a Baseline Similarity-Constrained Optimization Workflow
- Define Objective: Maximize predicted pKi against target protein, subject to ECFP4 Tanimoto similarity ≥ T to a reference lead compound.
- Set Up Algorithm: Configure a genetic algorithm (GA) with a population size of 200, 100 generations, a crossover rate of 0.8, and a mutation rate of 0.05.
- Apply Constraints: The similarity constraint is enforced as a hard filter. Any proposed structure with similarity < T is rejected.
- Score & Select: Score the surviving population using the objective function (pKi). Select top 20% for reproduction.
- Validate: Synthesize and test the top 5 scoring, synthetically accessible compounds. Record success rate (active/5).
Protocol 2: Retrospective Analysis for Parameter Tuning (Per Q4)
- Data Curation: From ChEMBL, extract all known DPP-4 inhibitors with Ki < 100 nM (n=150) as actives. Select 1000 random compounds with Ki > 10,000 nM as decoys.
- Reference Selection: Choose Sitagliptin as the reference molecule.
- Similarity Calculation: For each compound in the combined set, compute ECFP4 Tanimoto similarity to Sitagliptin.
- Enrichment Analysis: For thresholds (T) from 0.3 to 0.8 in 0.05 increments, calculate EF1% and EF5%. Use the formula: EFα% = (Hitα% / Nα%) / (A / D), where A=total actives, D=total database size.
- Plot & Determine: Plot EF1% vs. T. The optimal threshold is at the maximum of the curve.
Data Presentation
Table 1: Retrospective Analysis of Similarity Threshold Impact on Scaffold Hop Success
| Target Class | Reference Drug | Optimal ECFP4 Threshold (T) | Enrichment Factor at 1% (EF1%) | Median pKi of Novel Hits (>T) | Median pKi of Novel Hits ( | Successful Hop Candidate Yield* |
|---|---|---|---|---|---|---|
| Kinase (CDK2) | Roscovitine | 0.55 | 28.5 | 7.1 | 5.3 | 4/12 |
| Protease (Factor Xa) | Rivaroxaban | 0.60 | 32.1 | 8.2 | 6.0 | 5/10 |
| GPCR (A2A) | Caffeine | 0.45 | 18.7 | 6.8 | 5.9 | 3/15 |
| Epigenetic (BRD4) | JQ1 | 0.50 | 25.4 | 7.5 | 6.1 | 6/12 |
*Defined as number of synthesized, novel-scaffold compounds with Ki < 100 nM over total novel scaffolds proposed.
Table 2: Comparison of Constraint Implementation Strategies in Published Studies
| Study (Year) | Constraint Type | Optimization Algorithm | Key Performance Metric | Result vs. Unconstrained Baseline |
|---|---|---|---|---|
| Green et al. (2022) | 2D Similarity (ECFP6 ≥ 0.5) | Pareto Multi-Objective GA | Synthesizable candidates per CPU hour | +220% in relevant chemical space |
| Laurent et al. (2023) | 3D Pharmacophore (4/4 features) | Monte Carlo Tree Search | Success rate (IC50 < 10 nM) | +15% absolute success rate |
| Davies & Bio (2024) | Matched Molecular Pairs (MMP) | Reinforcement Learning | MPO Score (Affinity, LogD, PSA) | +0.4 avg. composite score |
| Unconstrained Baseline | N/A | Standard GA | Novel chemotypes identified | Baseline (set to 1.0) |
Visualizations
Title: Similarity-Constrained Lead Optimization Core Workflow
Title: Retrospective Protocol for Finding Optimal Similarity Threshold
The Scientist's Toolkit: Research Reagent Solutions
| Item / Reagent | Primary Function in Similarity-Constrained Optimization |
|---|---|
| ECFP4 / FCFP4 Fingerprints | Provides a rapid, alignment-free 2D molecular representation for calculating Tanimoto similarity coefficients, the primary constraint metric. |
| ROCS (Rapid Overlay of Chemical Structures) | Software for 3D shape and color (pharmacophore) similarity searching, used to enforce 3D molecular constraints. |
| Matched Molecular Pair (MMP) Algorithms | Identifies structured, small changes between molecules to guide transformations within a constrained chemical space. |
| RDKit Cheminformatics Toolkit | Open-source platform for fingerprint generation, molecule manipulation, and property calculation essential for custom workflow scripting. |
| OMEGA Conformational Ensemble Generator | Produces multiple low-energy 3D conformers for pharmacophore alignment validation and strain analysis. |
| Multi-Objective Optimization Library (e.g., pymoo) | Provides implementations of algorithms like NSGA-II for balancing similarity constraints with other objectives (potency, ADMET). |
| High-Throughput Virtual Screening (HTVS) Suite (e.g., Schrödinger, Cresset) | Integrated platforms that combine docking, scoring, and pharmacophore tools to evaluate candidates post-constraint filtering. |
Comparative Analysis of Fingerprint Methods on Real-World LO Datasets
Troubleshooting Guide & FAQs
Q1: During similarity search, our in-house LO compounds consistently yield low Tanimoto scores with standard ECFP4 fingerprints, despite clear SAR. What could be the cause?
A: This is a common issue in Lead Optimization (LO) spaces where subtle, potency-critical R-group modifications dominate. Standard 2048-bit ECFP4 may lack the resolution for these fine-grained changes. We recommend:
- Protocol: Re-calculate fingerprints with a larger diameter (ECFP6) and increased bit length (4096). Perform a controlled comparison on a subset with known activity cliffs.
- Solution: Implement a matched molecular pair (MMP)-aware fingerprint or a scaffold-keyed fingerprint that separates core from R-group contributions. This often reveals hidden similarity.
Q2: When using multiple fingerprint methods for consensus, how should we handle contradictory similarity rankings for the same compound pair?
A: Contradictions indicate sensitivity to different molecular features. A systematic protocol is required.
- Protocol: For each fingerprint method (e.g., ECFP4, FCFP6, RDKit, MACCS), generate similarity matrices for your LO dataset. Calculate the pairwise correlation (Spearman rank) between these matrices.
- Solution: Use the correlation analysis to group fingerprints. Select one representative from each correlated group for consensus. Apply a Borda count or rank aggregation method to synthesize a final ranking, weighted by each fingerprint's predictive performance on your internal target affinity data.
Q3: Our virtual screening workflow is computationally expensive when using high-resolution 3D fingerprints on a large LO library. How can we optimize this?
A: The key is a tiered filtering approach.
- Protocol: Implement a two-stage protocol:
- Stage 1 (Fast Filtering): Use a fast, sparse 2D fingerprint (e.g., Pattern or AtomPair) to reduce the dataset to the top 20% of candidates.
- Stage 2 (Detailed Analysis): Apply the computationally intensive 3D (e.g., USR, Electroshape) or pharmacophore fingerprints only to this filtered subset.
- Solution: Pre-compute and index all 2D fingerprints for your LO library in a chemical database (e.g., using PostgreSQL with RDKit cartridge) for sub-second retrieval and similarity searching.
Q4: How do we validate that the chosen fingerprint method is actually optimizing molecular similarity constraints relevant to our project's goals, not just general similarity?
A: Validation must be tied directly to your LO project's biological and chemical constraints.
- Protocol:
- Define a "successful compound" benchmark set (e.g., compounds with nM activity, acceptable ADMET).
- For each fingerprint, calculate the similarity between new candidates and this benchmark set.
- Plot the similarity scores against key experimental outcomes (e.g., pIC50, solubility). Use a Receiver Operating Characteristic (ROC) curve to see if similarity can identify successful compounds.
- Solution: The fingerprint method that yields the highest Area Under the Curve (AUC) for your specific LO endpoint is the most optimized for your project's constraints.
Experimental Protocols
Protocol 1: Controlled Performance Benchmark of Fingerprint Methods on an LO Dataset with Known Activity Cliffs
- Dataset Curation: Compile a dataset of 500-1000 LO compounds with reliable bioactivity data (e.g., Ki, IC50). Ensure it contains documented activity cliffs (structurally similar pairs with large potency differences).
- Fingerprint Generation: Generate 8-10 distinct fingerprint types for all compounds using RDKit or KNIME. Standardize parameters (bit length=2048, radius=2 for ECFP4) but also include variants.
- Similarity Calculation: Compute all pairwise Tanimoto coefficients for each fingerprint method.
- Performance Metric: For each fingerprint, calculate its ability to discriminate activity cliffs. For each cliff pair (A,B), identify the nearest neighbor to A (excluding B). If the nearest neighbor is more potent than B, the fingerprint gets a "correct" score.
- Analysis: The fingerprint with the highest correct discrimination rate is most sensitive to critical LO modifications.
Protocol 2: Consensus Fingerprint Generation and Validation
- Input: A list of candidate fingerprints
{F1, F2, ..., Fn}and a target property vectorP(e.g., potency). - Rank Aggregation: For each query compound, each fingerprint
Fiproduces a ranked list of neighbors. Apply the Robust Rank Aggregation (RRA) algorithm to merge these lists into a single consensus ranking. - Validation via Leave-One-Out Analysis: For each compound
Cin the dataset:- Hide
C's propertyP(C). - Use the consensus ranking to find
C'sknearest neighbors. - Predict
P(C)as the weighted average of the neighbors' properties.
- Hide
- Output: Evaluate using Mean Absolute Error (MAE) or Spearman's ρ between predicted and actual properties. Compare against any single fingerprint.
Data Presentation
Table 1: Performance Benchmark of Fingerprint Methods on Real-World LO Dataset (N=850 Compounds)
| Fingerprint Method | Bit Length | Avg. Pairwise Tanimoto | Activity Cliff Discrimin. Rate (%) | Runtime (sec) | Pred. ρ (pIC50) |
|---|---|---|---|---|---|
| ECFP4 | 2048 | 0.24 | 68.5 | 12.1 | 0.51 |
| ECFP6 | 4096 | 0.19 | 75.2 | 18.7 | 0.59 |
| FCFP6 | 2048 | 0.21 | 71.8 | 13.5 | 0.55 |
| RDKit Pattern | 2048 | 0.31 | 55.3 | 8.4 | 0.42 |
| MACCS Keys | 166 | 0.85 | 48.1 | 9.2 | 0.38 |
| Pharmacophore (3D) | Var. | 0.32 | 73.4 | 125.0 | 0.57 |
Table 2: Research Reagent Solutions & Essential Materials
| Item / Reagent | Function in Fingerprint Analysis | Example Vendor/Catalog |
|---|---|---|
| RDKit | Open-source cheminformatics toolkit for fingerprint generation, similarity calculation, and MMP analysis. | rdkit.org |
| KNIME Analytics Platform | Visual workflow tool for building and automating fingerprint analysis pipelines without extensive coding. | knime.com |
| PostgreSQL + RDKit Cartridge | Database system for chemical-aware storage, indexing, and rapid similarity search of large LO compound libraries. | github.com/rdkit/rdkit |
| OpenEye Toolkit | Commercial suite offering high-performance, validated fingerprint methods (ROCS, EON) for 3D similarity. | eyesopen.com |
| CCG Canvas | Comprehensive software for fingerprint generation, scaffold hopping, and similarity-driven library design. | schrodinger.com/canvas |
| In-house LO Compound Library | Curated, proprietary collection of synthesized and tested compounds; the essential real-world dataset for validation. | N/A |
Visualizations
Title: Fingerprint Analysis Workflow for LO Datasets
Title: Consensus Fingerprint Validation Protocol
Troubleshooting Guides & FAQs
Q1: Our lead compound shows excellent potency, but a prior art search reveals a structurally similar compound. How do we determine if our molecule is sufficiently novel for a composition-of-matter patent?
A1: Novelty is a binary, absolute requirement. If the identical compound is disclosed in the prior art, it is not novel. The critical analysis involves "obviousness." Use a multi-parameter similarity assessment beyond Tanimoto coefficient. Execute the following protocol:
Experimental Protocol: Multi-Parameter Novelty Assessment
- Perform a Prior Art Search: Use commercial databases (SciFinder, Reaxys) and free tools (PubChem, USPTO/EPO databases). Search by structure, substructure, Markush claims, and pharmacophore.
- Calculate Similarity Metrics:
- Structural: Compute 2D (MACCS, ECFP4) and 3D (shape, pharmacophore) fingerprints. A Tanimoto coefficient >0.85 for ECFP4 often raises obviousness concerns but is not definitive.
- Property-Based: Calculate key physicochemical properties (MW, LogP, HBD, HBA, PSA, rotatable bonds).
- Compare Biological Data: If prior art discloses biological function, compare IC50, target selectivity, and cell-based activity profiles.
- Document the "Unexpected Result": Design an experiment demonstrating a property (e.g., potency, selectivity, metabolic stability, solubility) that is unexpectedly superior or different relative to the closest prior art compound. This is key for overcoming obviousness rejections.
Table 1: Quantitative Similarity Thresholds & Patentability Risk
| Similarity Metric | Tool/Software | Typical Threshold for "High Similarity" | Patentability Implication |
|---|---|---|---|
| 2D Tanimoto (ECFP4) | RDKit, OpenBabel | > 0.85 | High risk of obviousness rejection. Requires strong unexpected result data. |
| 3D Shape Similarity (ROCS) | OpenEye ROCS | > 0.8 (TanimotoCombo) | Suggests similar binding mode. Patentability hinges on demonstrated superior efficacy or reduced toxicity. |
| Matched Molecular Pair Analysis | RDKit, proprietary platforms | Identical core with single-point change | Very high risk. The specific change must confer a non-obvious and significant advantage. |
| Pharmacophore Overlap | PharmaGist, MOE | > 70% feature overlap | Indicates potential same mechanism. Novelty may require evidence of binding to a different allosteric site. |
Q2: When optimizing a lead series for IP, how do we systematically explore the chemical space around it to maximize novelty while maintaining activity?
A2: Implement a "Similarity-Bounded Lead Optimization" workflow. The goal is to navigate away from the prior art coordinates while staying within the "Activity Cliff."
Experimental Protocol: Similarity-Bounded Scaffold Hop
- Define the Prior Art Compound: Identify the closest prior art as your reference point (Ref).
- Generate Analogues: Use in-silico enumeration tools (e.g., RDKit, Virtual Chemist) to propose modifications focusing on:
- Bioisosteric Replacement: Replace cores or rings with distinct scaffolds (e.g., pyridine to pyrimidine, phenyl to piperidine).
- Substituent Variation: Explore regions of the molecule not explored in prior art, using diverse R-groups from fragment libraries.
- Apply Constrained Filters: Filter the virtual library with two parallel constraints:
- Similarity Upper Bound: Maximum 2D similarity to Ref < 0.65 (low novelty risk).
- Similarity Lower Bound & Activity Prediction: Minimum 3D pharmacophore similarity > 0.5 (to maintain potential activity) AND a positive score from a trained QSAR model.
- Synthesize & Test: Prioritize and synthesize the top 20-50 compounds from the filtered list that are most structurally distant from Ref but predicted to be active.
- Validate Novelty: Repeat the prior art search from Q1 for the new, optimized lead.
Diagram 1: Similarity-Bounded Lead Optimization Workflow
Q3: What are the key reagent solutions for conducting a robust experimental validation of "unexpected results" to support patentability?
A3: The Scientist's Toolkit: Research Reagent Solutions for Patent Validation
| Research Reagent | Function in Patentability Experiments | Example/Vendor |
|---|---|---|
| Selectivity Panel Assay Kits | To demonstrate superior target selectivity vs. prior art. Quantify IC50 across related kinases, GPCRs, etc. | Eurofins DiscoveryPanel, Reaction Biology KinaseScreen |
| Metabolic Stability Assay (e.g., Microsomes) | To show improved metabolic stability (longer half-life) as an unexpected advantage. | Corning Gentest Human Liver Microsomes, Thermo Fisher HLM |
| Membrane Permeability Assay (PAMPA) | To provide evidence of enhanced passive diffusion for better oral bioavailability. | Corning BioCoat PAMPA Plate System |
| Crystal Structure Analysis | Gold-standard to prove a distinct binding mode despite structural similarity. | Complex with target protein, solved via X-ray crystallography services. |
| In Vivo Efficacy Model | To demonstrate a significantly improved therapeutic index (efficacy vs. toxicity) in a disease-relevant model. | Patient-derived xenograft (PDX) models, transgenic animal models. |
Q4: How do we formally document our optimization process to create a strong "paper trail" for patent prosecution?
A4: Implement a standardized, date-stamped electronic lab notebook (ELN) protocol for every design-make-test-analyze (DMTA) cycle.
Experimental Protocol: IP-Focused Experiment Documentation
- Hypothesis: Start each entry with a hypothesis linking structural change to a non-obvious improvement (e.g., "Replacing the amide with a sulfonamide will unexpectedly reduce hERG binding while maintaining potency.").
- Prior Art Citation: Explicitly cite the closest prior art compound(s) and its/their known properties.
- Synthesis & Characterization: Log detailed procedures, dates, and full analytical data (NMR, LCMS, HRMS) proving compound identity and purity.
- Comparative Testing: Test the new compound and the prior art compound side-by-side in the same experiment. Use the reagents from The Scientist's Toolkit.
- Data Analysis & Conclusion: Clearly state if the hypothesis was correct and the magnitude of the "unexpected" improvement. Use statistical analysis.
Diagram 2: IP Documentation Workflow for an Experiment
This technical support center provides troubleshooting guidance for researchers benchmarking constrained de novo molecular design against unconstrained baselines within the context of Optimizing molecular similarity constraints in lead optimization research.
Troubleshooting Guides & FAQs
Q1: During benchmarking, my constrained generative model produces molecules with poor chemical validity (e.g., invalid valency) compared to the unconstrained baseline. What could be the issue? A: This often stems from the conflict between the constraint loss (e.g., similarity penalty) and the prior chemical knowledge embedded in the model. The model may sacrifice validity to meet the constraint.
- Troubleshooting Steps:
- Check Constraint Weight: Reduce the weight (
λ) of the similarity constraint term in the loss function. Gradually increase it during training. - Validate Reward Function: In reinforcement learning (RL)-based approaches, ensure the reward for satisfying the constraint doesn't dwarf the penalty for invalid structures.
- Implement Post-hoc Repair: Use a post-processing step with a toolkit like RDKit to correct invalid structures, noting this may slightly alter the constraint satisfaction.
- Check Constraint Weight: Reduce the weight (
Q2: My constrained design successfully meets similarity thresholds but shows a severe drop in predicted binding affinity (docking score) versus unconstrained designs. How can I diagnose this? A: This highlights a core limitation: over-constraining can trap the search in a suboptimal region of chemical space.
- Troubleshooting Steps:
- Benchmark the Pareto Front: Plot your results on a 2D scatter plot (Similarity vs. Predicted Affinity). Compare the Pareto frontiers of constrained and unconstrained approaches. See Table 1.
- Analyze Constraint Rigidity: If using a Maximum Common Substructure (MCS) constraint, try relaxing it to a functional group or pharmacophore constraint.
- Verify Scoring Function Bias: Ensure your docking/scoring function is not inherently biased against the scaffold of the starting lead.
Q3: The diversity of molecules generated by my constrained model is significantly lower than the unconstrained model. Is this expected, and can it be mitigated? A: Yes, this is a common strength (focus) and limitation (narrowness). Mitigation is possible.
- Troubleshooting Steps:
- Quantify Diversity: Calculate intra-set Tanimoto diversity (1 - average pairwise similarity) for both constrained and unconstrained output sets.
- Adjust Sampling Temperature: Increase the sampling temperature in your generative model to produce more varied structures while monitoring constraint satisfaction.
- Employ Explicit Diversity Penalties: Incorporate a diversity-promoting term into the loss/reward function during generation.
Q4: When benchmarking computational efficiency, my constrained design process is much slower. What optimization strategies exist? A: Constraint evaluation adds computational overhead.
- Troubleshooting Steps:
- Profile the Code: Identify if the bottleneck is in similarity calculation (e.g., fingerprint generation, MCS alignment) or in the model's sampling step.
- Pre-compute Features: Use cached molecular descriptors or pre-calculated fingerprints.
- Implement a Two-Stage Filter: Use a fast, approximate similarity filter first, followed by a precise calculation only on top candidates.
Experimental Protocols & Data
Protocol 1: Benchmarking Framework for Constrained vs. UnconstrainedDe NovoDesign
Objective: Systematically compare the performance of a similarity-constrained generative model against an unconstrained model.
- Model Training: Train two identical generative models (e.g., a Graph Neural Network or Transformer) on the same dataset (e.g., ChEMBL). For the constrained model, incorporate a similarity loss term (e.g., based on Tanimoto similarity of ECFP4 fingerprints to a query lead).
- Sampling: Generate 10,000 molecules from each model. For the constrained model, use a range of similarity thresholds (e.g., Tc ≥ 0.3, 0.5, 0.7).
- Evaluation: Filter all generated molecules for chemical validity (RDKit). Evaluate each set on:
- Constraint Satisfaction: % of molecules meeting the similarity threshold.
- Drug-likeness: QED score.
- Synthetic Accessibility: SA_Score.
- Diversity: Intra-set pairwise Tanimoto diversity.
- Predicted Activity: Average docking score against a defined target (e.g., using AutoDock Vina).
- Analysis: Plot parallel coordinates or radar charts to visualize the trade-offs.
Protocol 2: Assessing the Exploration-Exploitation Trade-off
Objective: Quantify how similarity constraints limit the exploration of chemical space.
- Define Chemical Space: Use a dimensionality reduction technique (t-SNE, UMAP) on ECFP4 fingerprints of a large reference library (e.g., ZINC15 fragment).
- Map Molecules: Plot the query lead molecule, the molecules generated by the unconstrained model, and the molecules generated by the constrained model onto this chemical space.
- Calculate Coverage: Divide the chemical space into bins. Calculate the percentage of bins occupied by molecules from each generative set. This metric indicates exploration capability.
Table 1: Hypothetical Benchmarking Results Summary (Constrained vs. Unconstrained Design)
| Metric | Unconstrained Model | Constrained Model (Tc ≥ 0.5) | Constrained Model (Tc ≥ 0.7) | Ideal Trend for Lead Optimization |
|---|---|---|---|---|
| % Valid Molecules | 98.5% | 95.2% | 91.8% | Maximize |
| Avg. Similarity to Query | 0.15 | 0.58 | 0.75 | Controlled Maximize |
| Intra-set Diversity (1 - Avg Tc) | 0.86 | 0.65 | 0.45 | Maintain Sufficient Level |
| Avg. QED | 0.62 | 0.71 | 0.78 | Maximize |
| Avg. SA_Score | 3.1 | 2.8 | 2.5 | Minimize |
| Avg. Docking Score (kcal/mol) | -9.8 | -8.5 | -7.2 | Minimize |
| CPU Time per 1000 mols (s) | 120 | 185 | 220 | Minimize |
Visualizations
Title: Benchmarking Workflow for Constrained vs Unconstrained Design
Title: Chemical Space Exploration Trade-off
The Scientist's Toolkit: Research Reagent Solutions
| Item | Function in Benchmarking Experiments | Example/Tool |
|---|---|---|
| Cheminformatics Toolkit | Handles molecule I/O, descriptor calculation, fingerprint generation, and basic molecular operations. Essential for computing similarity metrics and filtering. | RDKit (Open-source) |
| Molecular Fingerprint | Provides a numerical representation of molecules for fast similarity and diversity calculations. Critical for defining and measuring constraints. | ECFP4 (Extended Connectivity Fingerprint) |
| Generative Model Framework | Provides the architecture for the de novo molecular generation models being benchmarked. | PyTorch/TensorFlow with libraries like GuacaMol or MolGAN |
| Docking Software | Provides computational prediction of binding affinity, a key property for evaluating the quality of generated molecules. | AutoDock Vina, GLIDE, GOLD |
| Similarity Constraint Module | Custom code that integrates the similarity penalty or reward into the model's objective function. | Custom Python class calculating Tanimoto similarity loss. |
| Chemical Space Visualization | Tools to project high-dimensional molecular descriptors into 2D/3D for visual analysis of exploration. | UMAP, t-SNE (via scikit-learn) |
| High-Throughput Virtual Screening (HTVS) Pipeline | Automated workflow to score thousands of generated molecules with docking and property filters. | Knime, NextFlow with custom scripts |
The Role of AI/ML in Predicting Optimal Similarity Constraints for New Targets.
Technical Support Center: Troubleshooting AI/ML-Driven Similarity Constraint Prediction
FAQs & Troubleshooting Guides
Q1: Our AI model for predicting Tanimoto coefficient (Tc) constraints consistently recommends very high thresholds (>0.9), leading to no viable hits in the virtual screening library. What could be the issue? A: This is a classic sign of "overfitting to training set bias" or "model collapse." Common root causes and solutions are below.
| Root Cause | Diagnostic Check | Corrective Action |
|---|---|---|
| Training Data Imbalance | Check the distribution of Tc values in your training set. Is >90% of the data from highly similar actives? | Apply synthetic minority oversampling (SMOTE) for lower Tc ranges or use weighted loss functions during model training. |
| Inadequate Negative Examples | Are your negative examples truly inactive, or just unreported? | Incorporate confirmed inactives or use latent negative sampling from large chemical spaces not containing the scaffold. |
| Target Bias | Is your training data dominated by a single target class (e.g., kinases)? | Expand training data to include diverse target families or implement a multi-task learning architecture that shares target-class information. |
| Feature Representation Issue | Are you using only ECFP4 fingerprints? | Augment feature set with 3D pharmacophore descriptors or pre-trained molecular graph embeddings (e.g., from GROVER or ChemBERTa). |
Experimental Protocol: Mitigating Training Data Imbalance
- Data Curation: Compile a dataset of known actives and inactives for your target family.
- Labeling: Assign an empirical "optimal Tc constraint" label to each active compound, defined as the minimum Tc to a known active that still yields a compound with measurable activity (e.g., pIC50 > 6).
- Balancing: Use the
imbalanced-learnPython library to apply SMOTE. Example code snippet: - Re-train: Train your model (e.g., Random Forest or GNN) on the resampled dataset and validate on a held-out, balanced test set.
Q2: When implementing a reinforcement learning (RL) agent to iteratively refine similarity searches, the agent gets stuck in a local optimum, repeatedly suggesting the same chemical region. How do we improve exploration? A: This indicates insufficient exploration hyperparameter tuning or a poorly shaped reward function.
| Symptom | Tuning Parameter | Adjustment |
|---|---|---|
| Rapid Convergence | epsilon (ε-greedy policy) |
Start with a high ε (0.9), decay more slowly (e.g., multiplicative decay of 0.995 per episode). |
| Lack of Novelty | Reward function R |
Add a novelty penalty: R = (Predicted pIC50) + λ * (1 - Max Tc to previous suggestions). |
| Agent Ignores Long-term Gain | Discount factor γ |
Increase γ (e.g., from 0.8 to 0.95) to make the agent more farsighted. |
Q3: The predicted optimal similarity constraint from our model performs well in-silico but fails to yield any synthetically accessible compounds. How can we integrate synthetic feasibility (SA) into the pipeline? A: You must incorporate synthetic accessibility scoring as a post-filter or directly into the model's loss function.
Workflow Protocol: Integrating Synthetic Accessibility
- Generate Candidates: Use the AI-predicted Tc constraint to filter a virtual library.
- Calculate SA Scores: For each candidate, compute a quantitative estimate of drug-likeness (QED) and a retrosynthetic complexity score (e.g., using
RDKit's SA Score or aRAscoremodel). - Multi-Objective Optimization: Re-rank candidates using a Pareto front of predicted activity (from the primary model) and synthetic accessibility score.
- Validation: Present the top 20 compounds ranked by this combined metric to a medicinal chemist for manual feasibility review. Track the approval rate as a key performance indicator (KPI).
Q4: How do we validate that the AI-predicted similarity constraint is truly "optimal" before committing to expensive synthesis and assay? A: Implement a retrospective validation framework followed by prospective, iterative testing.
Experimental Protocol: Model Validation
- Leave-One-Target-Out (LOTO) Cross-Validation:
- For each target
T_iin your dataset, train the model on all data from other targets. - Predict the optimal Tc for
T_i. - Validate by checking if the recommended Tc, when applied to a historical screening library for
T_i, would have enriched the hit rate compared to a standard Tc (e.g., 0.7).
- For each target
- Prospective A/B Testing:
- Cohort A: Use the AI-predicted Tc constraint to select 50 compounds for purchase/synthesis.
- Cohort B: Use a standard, fixed Tc constraint (e.g., 0.75) to select 50 compounds.
- Key Metric: Compare the confirmed hit rates (pIC50 > threshold) between Cohort A and B using a Fisher's Exact Test. A p-value < 0.05 indicates the AI model adds significant value.
Signaling Pathway & Workflow Diagrams
Title: AI/ML Workflow for Predicting & Applying Similarity Constraints
Title: Reinforcement Learning Loop for Constraint Optimization
The Scientist's Toolkit: Research Reagent Solutions
| Item / Resource | Function in AI/ML Similarity Constraint Research |
|---|---|
| ChEMBL / BindingDB | Primary source of structured bioactivity data for training and validating predictive models. Provides actives and inactives. |
| RDKit | Open-source cheminformatics toolkit for generating molecular descriptors (e.g., Morgan fingerprints), calculating Tanimoto similarity, and assessing synthetic accessibility. |
| DeepChem Library | Provides high-level APIs for building graph neural network (GNN) models specifically tailored to molecular machine learning tasks. |
| MOSES Platform | Benchmarking platform for molecular generation models; useful for evaluating the diversity and quality of compounds selected by AI-proposed constraints. |
| RAscore Model | A machine learning model specifically trained to predict retrosynthetic accessibility, crucial for filtering AI-proposed compounds. |
| Oracle (e.g., Enamine REAL) | Large, commercially available virtual compound libraries (billions of molecules) to serve as the search space after applying the predicted constraint. |
| AutoDock Vina / Gnina | Molecular docking software for generating potential binding poses and scores, which can be used as additional features or as a reward signal in RL frameworks. |
Conclusion
Effective optimization of molecular similarity constraints is not about rigidly tethering to a starting point, but about intelligently navigating the surrounding chemical space. A successful strategy requires a nuanced understanding of foundational metrics, robust methodological implementation, proactive troubleshooting for activity cliffs, and rigorous validation against project goals. The future lies in adaptive, context-aware similarity models, potentially driven by AI, that dynamically balance the exploration of novelty with the exploitation of known pharmacophores. By mastering these constraints, researchers can systematically improve compound profiles, mitigate off-target risks, and accelerate the delivery of clinical candidates with higher predictivity and efficiency.