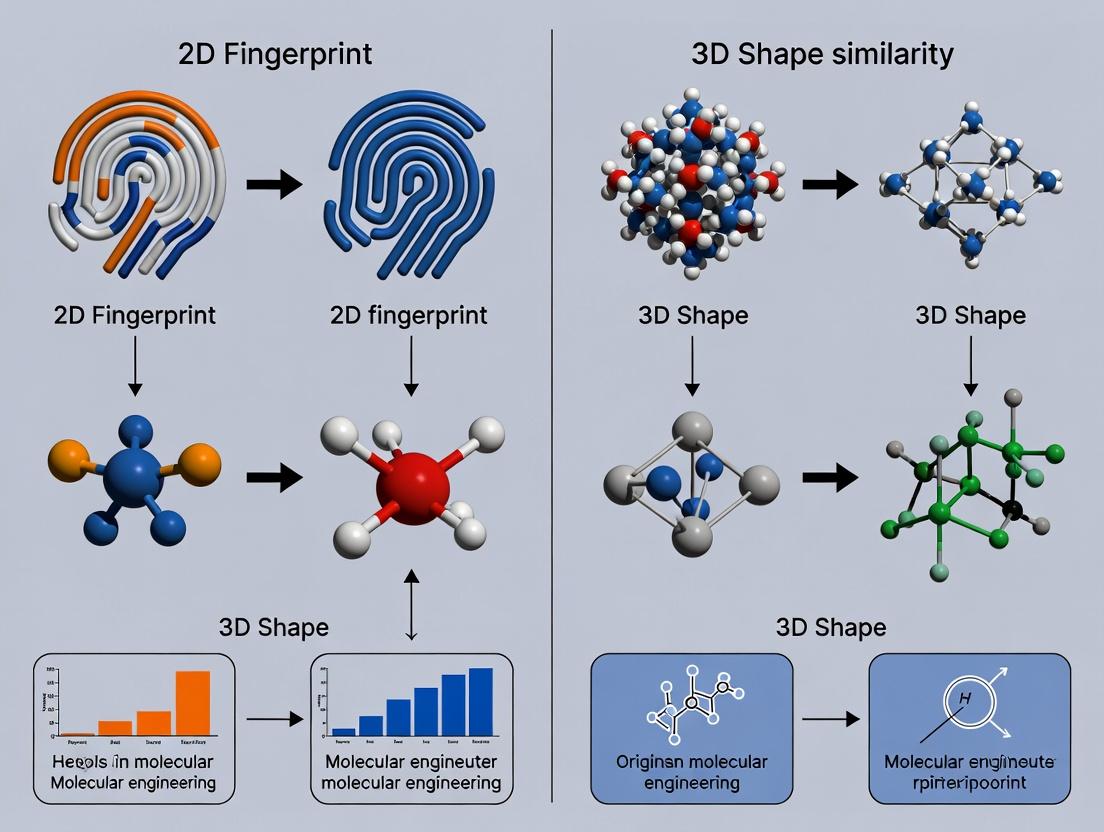
2D vs 3D Molecular Similarity: A Comprehensive Guide for Drug Discovery Researchers
This article provides a detailed comparison of 2D fingerprint and 3D shape similarity methods in computational drug discovery.
2D vs 3D Molecular Similarity: A Comprehensive Guide for Drug Discovery Researchers
Abstract
This article provides a detailed comparison of 2D fingerprint and 3D shape similarity methods in computational drug discovery. It explores their foundational principles, practical applications, optimization strategies, and validation benchmarks. Aimed at researchers and drug development professionals, it synthesizes current methodologies to guide the selection and implementation of these crucial tools for virtual screening, lead optimization, and scaffold hopping.
Understanding Molecular Similarity: Core Principles of 2D Fingerprints and 3D Shape
Molecular similarity is the computational and conceptual cornerstone of modern drug discovery. It underpins critical tasks from virtual screening and lead optimization to the prediction of off-target effects and drug repurposing. The central thesis is that structurally similar molecules are likely to exhibit similar biological activities. This application note, framed within ongoing research comparing 2D fingerprint and 3D shape similarity methods, provides detailed protocols and analyses for implementing these techniques in a discovery pipeline.
Core Concepts and Quantitative Comparison
Table 1: Comparison of 2D Fingerprint and 3D Shape Similarity Methods
| Feature | 2D Fingerprint Methods | 3D Shape/Conformer Methods |
|---|---|---|
| Molecular Representation | Bits representing presence/absence of substructures (e.g., MACCS, ECFP). | 3D atomic coordinates and steric/electrostatic fields (e.g., ROCS, Phase). |
| Primary Metric | Tanimoto Coefficient (TC): Intersection/Union of bit strings. | Tanimoto Combo: Sum of shape (Gaussian) and color (pharmacophore) similarity. |
| Speed | Extremely fast (1000s-1,000,000s molecules/sec). | Slower, requires conformer generation (10s-100s molecules/sec). |
| Conformer Dependence | None. Single, canonical representation. | Critical. Requires comprehensive conformer ensembles. |
| Best Application | High-throughput virtual screening of large libraries; scaffold hopping based on substructure. | Lead optimization; target-based screening where 3D pose is critical; scaffold hopping. |
| Typical TC/Combo Threshold | TC > 0.85 (high similarity); TC 0.45-0.65 (scaffold hop range). | Tanimoto Combo > 1.4 (high similarity). |
| Key Strength | Computational efficiency, ease of use, proven historical success. | Direct biological relevance, accounts for stereochemistry and conformation. |
Experimental Protocols
Protocol 1: High-Throughput Virtual Screening Using 2D Fingerprints
Objective: To rapidly screen a large compound library (e.g., ZINC20, >10 million molecules) against a known active query using 2D similarity.
Materials & Workflow:
- Query Molecule: A known active compound (SMILES format).
- Database: Library in SDF or SMILES format.
- Software: RDKit (Open Source) or KNIME/Pipeline Pilot nodes.
- Fingerprint: Generate 2048-bit ECFP4 fingerprints for the query and all database molecules.
- Calculation: Compute Tanimoto coefficient between query fingerprint and each database fingerprint.
- Ranking: Sort database compounds by descending Tanimoto coefficient.
- Thresholding: Apply a cutoff (e.g., TC > 0.45) to select hits for visual inspection and further study.
Protocol 2: 3D Shape-Based Similarity Screening
Objective: To identify molecules with similar 3D shape and pharmacophore features to a query ligand from a pre-filtered library.
Materials & Workflow:
- Query Conformer: A biologically active, low-energy 3D conformation of the query (e.g., from X-ray co-crystal structure).
- Database: Pre-generated multi-conformer database (e.g., using OMEGA).
- Software: Open3DALIGN (Open Source) or ROCS (Commercial).
- Alignment: For each database molecule, align each conformer to the query using a Gaussian shape overlay algorithm.
- Scoring: Calculate the Tanimoto Combo score (shape + color) for the best alignment.
- Ranking: Rank database molecules by descending Tanimoto Combo score.
- Analysis: Visually inspect top overlays (e.g., in PyMOL) to confirm shape and feature alignment.
Visualizing the Drug Discovery Workflow
Molecular Similarity Screening Cascade
The Scientist's Toolkit: Research Reagent Solutions
Table 2: Essential Resources for Molecular Similarity Research
| Item | Function & Example |
|---|---|
| Chemical Databases | Source compounds for screening. ZINC20 (free), ChEMBL (bioactivity data), corporate collections. |
| Cheminformatics Toolkits | Core programming libraries. RDKit (open-source, C++/Python), Open Babel (format conversion). |
| Fingerprint Software | Generate/compare 2D fingerprints. RDKit, CDK, commercial suites (Schrödinger, Cresset). |
| Conformer Generators | Produce representative 3D conformers. OMEGA (OpenEye/Free for Acad.), CONFORT, RDKit ETKDG. |
| 3D Alignment Tools | Perform shape/pharmacophore overlay. ROCS (OpenEye), Phase (Schrödinger), Open3DALIGN. |
| Visualization Software | Inspect structures and overlays. PyMOL, ChimeraX, Maestro (Schrödinger). |
| High-Performance Computing | Execute large-scale screens. Local Linux clusters or cloud computing (AWS, Azure). |
Critical Analysis and Pathway Visualization
The choice between 2D and 3D methods is not binary but sequential. A typical rational design pathway integrates both:
Integrated 2D/3D Lead Identification Pathway
Defining molecular similarity effectively requires a pragmatic, multi-faceted approach. 2D fingerprints provide an unparalleled first-pass filter to navigate vast chemical space efficiently. Subsequent application of 3D shape and pharmacophore methods adds a critical layer of mechanistic relevance, prioritizing hits more likely to adopt a bioactive pose. The synergy of both methodologies, as outlined in these protocols, is central to accelerating modern drug discovery pipelines.
Within the ongoing research comparing 2D fingerprint versus 3D shape similarity methods for virtual screening and ligand-based drug discovery, the 2D fingerprint paradigm remains a cornerstone for rapid, scalable compound similarity searching. This document provides detailed application notes and protocols for implementing and evaluating key 2D fingerprint methods, which prioritize topological and substructural features over conformational and spatial arrangements.
Core 2D Fingerprint Types & Quantitative Comparison
The table below summarizes the characteristics of prevalent 2D fingerprint algorithms, based on current literature and cheminformatics toolkits.
Table 1: Comparison of Key 2D Fingerprint Methods
| Fingerprint Type | Bit Length (Typical) | Generation Method | Key Features/Substructures Encoded | Common Use Case |
|---|---|---|---|---|
| ECFP (Extended Connectivity Fingerprint) | 1024, 2048, 4096 | Hashing of circular atom neighborhoods up to a given diameter. | Extended connectivity features, capturing functional groups and topology. | Lead optimization, SAR analysis, machine learning. |
| RDKit Topological Torsion | 2048, 4096 | Hashing of sequences of bonded atoms and their torsion angles. | Linear sequences of 4 connected atoms (or more). | Scaffold hopping, detecting conserved pharmacophores. |
| MACCS Keys (166-bit) | 166 | Predefined SMARTS patterns for specific substructures (e.g., carbonyl, aromatic ring). | 166 predefined structural fragments. | Fast pre-screening, coarse similarity assessment. |
| Path-Based (e.g., RDKit) | 1024, 2048 | Enumeration of all linear paths of bonded atoms within a specified length. | All molecular paths of a given bond length (e.g., 1-7 bonds). | General similarity, database searching. |
| Atom Pair | 1024, 2048 | Encodes pairs of atoms with their topological distance and atom types. | Atom type pairs (e.g., N..O) and the graph distance between them. | Scaffold hopping, distant similarity. |
Experimental Protocols
Protocol 3.1: Generating and Comparing 2D Fingerprints using RDKit
Objective: To generate multiple 2D fingerprint representations for a set of compounds and calculate pairwise Tanimoto similarities.
Materials:
- A dataset of compounds in SMILES or SDF format.
- RDKit (2024.03.x or later) Python environment.
- Jupyter Notebook or Python script environment.
Procedure:
- Data Preparation: Load the molecule set using
rdkit.Chem.rdmolfiles.SDMolSupplier()(for SDF) orrdkit.Chem.MolFromSmiles()(for SMILES list). - Fingerprint Generation:
- For ECFP4 (radius=2):
fp = rdkit.Chem.AllChem.GetMorganFingerprintAsBitVect(mol, radius=2, nBits=2048) - For Topological Torsion:
fp = rdkit.Chem.rdMolDescriptors.GetHashedTopologicalTorsionFingerprintAsBitVect(mol, nBits=2048) - For MACCS Keys:
fp = rdkit.Chem.rdMolDescriptors.GetMACCSKeysFingerprint(mol) - For Path-Based Fingerprint:
fp = rdkit.Chem.RDKFingerprint(mol, fpSize=2048)
- For ECFP4 (radius=2):
- Similarity Calculation:
- For two bit vectors
fp1andfp2, compute the Tanimoto coefficient:
- For two bit vectors
- Analysis: Create a similarity matrix for all compound pairs using each fingerprint type. Compare the matrices to assess correlation between different 2D methods.
Protocol 3.2: Virtual Screening with Substructural Keys (MACCS)
Objective: To perform a fast substructure-enriched similarity screen of a large compound library against a known active reference.
Materials:
- Reference active compound (query).
- Screening database (e.g., ZINC20 subset in SMILES format).
- ChemFP or RDKit with parallel processing capabilities.
Procedure:
- Query Processing: Generate the 166-bit MACCS keys fingerprint for the reference active molecule.
- Database Processing: Pre-compute MACCS keys fingerprints for the entire screening database. Store in a memory-efficient bit array format.
- Screening: Perform a bulk Tanimoto similarity calculation between the query fingerprint and every database fingerprint. Utilize vectorized operations or tools like ChemFP for speed.
- Ranking & Retrieval: Rank all database compounds by their Tanimoto similarity to the query. Apply a threshold (e.g., Tc >= 0.85) to select top hits.
- Validation: Inspect top hits for obvious shared substructures with the query. Optionally, pass hits to a more computationally intensive method (e.g., ECFP similarity or 3D shape screening) for further filtering.
Visualization & Workflows
Title: 2D Fingerprint Generation & Screening Workflow
Title: Performance Metrics for 2D vs 3D Method Comparison
The Scientist's Toolkit: Research Reagent Solutions
Table 2: Essential Tools & Resources for 2D Fingerprint Research
| Item/Category | Specific Example(s) | Function & Relevance to 2D Fingerprint Research |
|---|---|---|
| Cheminformatics Toolkits | RDKit, Open Babel, ChemFP | Core libraries for generating standardized 2D fingerprints (ECFP, MACCS, etc.) from molecular structures. Essential for protocol implementation. |
| Programming Environments | Python (Jupyter), KNIME, Nextflow | Flexible platforms for scripting fingerprint generation, similarity calculations, and analysis pipelines in reproducible workflows. |
| Benchmark Datasets | DUD-E, MUV, ChEMBL bioactivity data | Curated sets of active and decoy molecules for validating the retrieval performance (AUC, EF) of 2D fingerprint methods against 3D shape. |
| High-Performance Computing (HPC) / Cloud | AWS ParallelCluster, Google Cloud Life Sciences | Enables large-scale virtual screening campaigns using 2D fingerprints across million+ compound libraries in tractable timeframes. |
| Similarity Search Engines | FPSim2, ChemFP, Oracle Cartridge | Optimized libraries and database cartridges for ultra-fast Tanimoto similarity searches on pre-computed fingerprint databases. |
| Visualization & Analysis | Matplotlib, Seaborn, Spotfire | Tools for creating enrichment curves, similarity heatmaps, and chemical space plots to interpret and present 2D fingerprint screening results. |
Application Notes
The comparative analysis of 2D fingerprint versus 3D shape similarity methods is a cornerstone of modern computational drug discovery. While 2D methods, based on molecular substructures and topological descriptors, offer speed and high-throughput screening capability, 3D shape-based approaches capture the spatial and electronic complementarity essential for molecular recognition. The primary application of 3D shape and pharmacophore alignment lies in scaffold hopping, virtual screening, and lead optimization, where identifying functionally similar molecules with distinct chemotypes is paramount. Recent studies (2023-2024) demonstrate that 3D shape methods significantly outperform 2D fingerprints in identifying active compounds with low 2D similarity, particularly for targets with well-defined binding pockets requiring specific steric and electrostatic complementarity. However, 2D methods remain superior for target-family profiling and when ligand binding modes are highly variable.
Quantitative Performance Comparison
The following tables summarize recent benchmarking data from key studies.
Table 1: Virtual Screening Enrichment in Benchmark Sets (Average EF1%)
| Method Category | Specific Method/Software | DUD-E Set | DEKOIS 2.0 | MUV Set | Notes |
|---|---|---|---|---|---|
| 2D Fingerprint | ECFP4 | 18.2 | 15.7 | 8.1 | High consistency, low scaffold hop. |
| 2D Fingerprint | RDKit Pattern | 16.5 | 14.3 | 7.5 | Fastest method. |
| 3D Shape/Align. | ROCS (Shape+Tanimoto) | 24.7 | 28.5 | 12.3 | Best early enrichment. |
| 3D Shape/Align. | Phase Shape | 22.1 | 25.8 | 10.9 | Good pharmacophore integration. |
| 3D Conformer | USR (Ultrafast Shape) | 12.4 | 18.2 | 6.5 | Alignment-free, low memory. |
| Hybrid | E3FP (3D Fingerprint) | 20.8 | 23.1 | 11.2 | Balance of speed and 3D info. |
Table 2: Computational Requirements and Output
| Parameter | 2D Fingerprint (ECFP4) | 3D Shape Alignment (ROCS) | 3D Pharmacophore (Phase) |
|---|---|---|---|
| Preprocessing Need | None (2D SMILE) | Multiple conformer generation | Conformers + feature perception |
| Speed (molecules/sec) | ~100,000 | ~100-1,000 | ~10-100 |
| Key Output | Similarity Coefficient (Tanimoto) | Shape Tanimoto Combo, Overlap Volume | Feature match score, RMSD of alignment |
| Scaffold Hop Potential | Low | High | Very High |
| Dependence on Ref. Conformer | No | Critical | Critical |
Experimental Protocols
Protocol 1: Standard 3D Shape-Based Virtual Screening Workflow
Objective: To screen a large database of compounds against a known active ligand using 3D shape and chemical feature alignment.
Materials: See "Research Reagent Solutions" below.
Procedure:
- Reference Ligand Preparation:
- Obtain the 3D structure (e.g., from a protein-ligand co-crystal, PDB).
- Using OpenBabel or LigPrep, add hydrogens, assign correct bond orders, and optimize the geometry using the MMFF94s force field.
- Define the pharmacophore features (e.g., hydrogen bond donor/acceptor, ring, hydrophobic zone) manually or via tools like Phase or MOE.
Database Preparation:
- For each molecule in the screening database (e.g., ZINC, Enamine REAL), generate a multi-conformer ensemble.
- Use OMEGA with standard settings:
MaxConfs 200,RMSD threshold 0.8 Å, an energy window of 10 kcal/mol. - Output conformers in a format compatible with the alignment software (e.g., .sdf, .mae).
Shape/Pharmacophore Alignment:
- Load the prepared reference ligand as the query into ROCS.
- Set the scoring function to ShapeTanimoto or ComboScore (ShapeTanimoto + ColorTanimoto, where "Color" denotes chemical features).
- Load the multi-conformer database.
- Execute the alignment. The software will perform a rapid superposition of every database conformer onto the query, optimizing the overlap.
Post-processing and Analysis:
- Rank results by the ComboScore.
- Visually inspect the top 100-500 hits using PyMOL or ChimeraX to verify plausible alignments and interactions.
- For promising hits, consider subsequent molecular docking into the target protein's binding site to assess complementarity and score using a more rigorous scoring function.
Protocol 2: Benchmarking 3D vs. 2D Methods
Objective: To quantitatively compare the scaffold-hopping capability of 3D shape and 2D fingerprint methods on a validated dataset.
Procedure:
- Dataset Curation:
- Select a benchmarking set like DUD-E or DEKOIS 2.0, which contains known actives and property-matched decoys for multiple targets.
- For a focused test, select targets known for enabling scaffold hops (e.g., Kinases, GPCRs).
Method Execution:
- For each target, use one known active as the query.
- 2D Method: Calculate the Tanimoto similarity between the query's ECFP4 fingerprint and all actives/decoys. Rank the database.
- 3D Method: Follow Protocol 1 using the same query. Rank the database by ComboScore.
- Ensure the actives and decoys are prepared identically for both methods (same protonation states, conformer generation for 3D).
Performance Metrics Calculation:
- Generate Enrichment Factors (EF) at 1% and 5% of the screened database.
- Plot Receiver Operating Characteristic (ROC) curves and calculate the Area Under the Curve (AUC).
- Specifically measure scaffold hop rate: For the top N hits (e.g., top 100), calculate the percentage of active compounds whose Murcko scaffold differs from the query scaffold.
Statistical Analysis:
- Perform paired t-tests across multiple targets to determine if differences in AUC or EF1% between methods are statistically significant (p < 0.05).
Visualizations
Title: 2D vs 3D Virtual Screening Workflow Comparison
Title: 3D Pharmacophore Alignment & Scoring Logic
The Scientist's Toolkit
Table 3: Key Research Reagent Solutions for 3D Shape Studies
| Item / Software | Primary Function | Key Consideration / Typical Use |
|---|---|---|
| OMEGA (OpenEye) | High-speed generation of multi-conformer 3D databases. | Critical preprocessing step for shape screening. Settings (MaxConfs, RMSD) affect results. |
| ROCS (OpenEye) | Rapid overlay of chemical structures using Gaussian molecular shape. | Industry standard for shape-based screening. ComboScore combines shape and "color" (features). |
| Phase (Schrödinger) | Creates and aligns pharmacophore models with flexible ligand alignment. | Excellent for incorporating explicit chemical feature constraints (H-bond, charges). |
| RDKit | Open-source toolkit for cheminformatics. Can generate conformers, fingerprints (including 3D), and basic shape alignment. | Essential for prototyping and custom method development. |
| PyMOL / ChimeraX | Molecular visualization. | Mandatory for visual inspection of top-ranked alignments to validate hits. |
| DUD-E / DEKOIS 2.0 | Benchmarking datasets with actives and property-matched decoys. | Gold standard for validating and comparing virtual screening methods. |
| MMFF94s / GAFF | Molecular mechanics force fields. | Used for geometry optimization of ligands and conformer energy minimization. |
Within the broader thesis comparing 2D fingerprint and 3D shape similarity methods in chemoinformatics, this document traces the evolution from foundational 2D similarity metrics, epitomized by the Tanimoto coefficient, to sophisticated 3D molecular shape comparison techniques using Gaussian overlays. This transition reflects the field's progression from connectivity-based screening to pharmacophore-aware, conformationally sensitive virtual screening, crucial for identifying bioactive molecules in drug development.
Quantitative Comparison of Key Methods
Table 1: Evolution of Key Similarity Methods & Performance Metrics
| Era & Method | Core Metric | Typical Benchmark Performance (AUC/Enrichment) | Computational Speed | Key Advantage | Primary Limitation |
|---|---|---|---|---|---|
| Classical 2D (c. 1990s) | Tanimoto (Jaccard) on Fingerprints (e.g., MACCS, ECFP4) | AUC: 0.70-0.85 (DUD-E benchmark) | Very Fast (>1000 cmpds/sec) | High throughput, robust, interpretable. | No 3D shape/pharmacophore info. |
| 3D Shape-Based (c. 2000s) | Volume Overlap (e.g., ROCS) | EF₁%: 10-30 (DUD-E) | Fast (10-100 cmpds/sec) | Direct shape matching, scaffold hopping. | Conformation-dependent, no electrostatics. |
| Gaussian Overlays (c. 2010s) | Shape+Chemistry Gaussian Similarity (e.g., OpenEye's ROCS, Schrödinger's Shape Screening) | EF₁%: 20-40 (DUD-E) | Moderate (1-10 cmpds/sec) | Smooth functions, better fit, combined shape/chem. | Slower, requires good conformer generation. |
| Ultrafast Shape Recognition (USR) | Distance Histogram Comparison | AUC: ~0.65-0.75 | Extremely Fast (>10⁴ cmpds/sec) | Alignment-free, works on single conformer. | Less accurate than alignment-based methods. |
Application Notes & Protocols
Protocol A: Classical 2D Similarity Screening Using Tanimoto Coefficients
Objective: To identify potential actives from a large compound library using 2D structural similarity to a known active reference molecule.
Materials:
- Reference molecule (SMILES string)
- Screening database (SDF or SMILES file)
- Cheminformatics toolkit (e.g., RDKit, Open Babel)
Procedure:
- Fingerprint Generation:
- For the reference and all database molecules, generate hashed topological fingerprints (e.g., ECFP4 with 2048 bits).
- Script Snippet (RDKit):
from rdkit import Chem; from rdkit.Chem import AllChem; fp = AllChem.GetMorganFingerprintAsBitVect(mol, 2, nBits=2048)
Similarity Calculation:
- Compute the Tanimoto coefficient (Tc) between the reference fingerprint (A) and each database fingerprint (B): Tc = |A ∩ B| / |A ∪ B| where | | denotes the number of set bits.
- Script Snippet:
from rdkit import DataStructs; tc = DataStructs.TanimotoSimilarity(fp_ref, fp_db)
Ranking & Analysis:
- Rank all database compounds in descending order of Tc.
- Apply a threshold (e.g., Tc > 0.4) to select candidates for further evaluation.
Protocol B: 3D Shape Similarity Screening with Gaussian Overlays (ROCS-like)
Objective: To identify compounds with similar 3D shape and chemistry to a reference ligand, enabling scaffold hopping.
Materials:
- Reference molecule 3D conformer (low-energy bioactive conformation preferred)
- Pre-generated multi-conformer database of screening compounds
- Gaussian overlay software (e.g., OpenEye ROCS, or academic tools like ShaEP)
Procedure:
- Conformer Preparation:
- Ensure the reference is a single, relevant 3D conformer.
- The screening database must be a multi-conformer SDF file, typically with 5-20 conformers per compound generated by tools like OMEGA.
Gaussian Representation:
- Each molecule is represented as a set of overlapping Gaussians centered on atoms. Shape is modeled by volume Gaussians; chemistry is modeled by "color" Gaussians representing pharmacophore features (e.g., donor, acceptor, hydrophobe).
- The similarity between two molecules is the optimization of the overlap integral of their Gaussian functions.
Alignment & Scoring:
- The algorithm performs a systematic search to align the database molecule's conformers to the reference.
- Two primary scores are calculated: ShapeTanimoto = (2 * O_ab) / (O_aa + O_bb), where O is the overlap integral. ColorTanimoto: Similar score for chemical feature overlap.
- A combo score is typically used:
ComboScore = ShapeTanimoto + w * ColorTanimoto(w often = 1).
Post-Processing:
- For each database compound, retain the highest-scoring conformer and its ComboScore.
- Rank the entire database by ComboScore. A ComboScore > 1.0 often indicates a promising hit.
Diagrams & Visual Workflows
Title: 2D vs 3D Similarity Screening Workflows
Title: Gaussian Overlap Scoring Principle
The Scientist's Toolkit: Research Reagent Solutions
Table 2: Essential Tools & Resources for Similarity Screening
| Item / Reagent | Function / Purpose | Example Vendor/Implementation |
|---|---|---|
| ECFP4 / Morgan Fingerprints | 2D circular fingerprints encoding atom environments for Tanimoto calculation. | RDKit, ChemAxon, OpenEye |
| MACCS Keys | 166-bit structural key fingerprint for substructure-based similarity. | RDKit, MDL (Accelrys) |
| OMEGA | Conformer generation software to create 3D multi-conformer databases for shape screening. | OpenEye Scientific Software |
| ROCS (Rapid Overlay of Chemical Structures) | Industry-standard tool for Gaussian molecular shape and feature overlay. | OpenEye Scientific Software |
| ShaEP | Open-source alternative for Gaussian overlay-based molecular alignment and scoring. | University of Eastern Finland |
| Ultrafast Shape Recognition (USR) | Alignment-free shape descriptor for rapid pre-screening. | Academic Code (e.g., PyDPI) |
| DUDE-E Benchmark Set | Benchmark database for evaluating virtual screening methods. | http://dude.docking.org/ |
| RDKit | Open-source cheminformatics toolkit for fingerprint generation, Tanimoto, and basic operations. | http://www.rdkit.org/ |
Application Notes
Within the context of a thesis comparing 2D fingerprint and 3D shape similarity methods for molecular screening, the selection and application of specific software tools are critical. These libraries enable the generation of descriptors, alignment, and quantification of molecular similarity from complementary perspectives.
RDKit is the cornerstone for 2D cheminformatics and also provides foundational 3D capabilities. It is used to generate topological fingerprints (e.g., Morgan fingerprints) for 2D similarity assessment via the Tanimoto coefficient. It also handles conformer generation and basic 3D descriptor calculation, serving as a common preparatory step for all subsequent 3D shape tools.
Open3DALIGN (O3A) is a dedicated, open-source tool for performing unsupervised, parameter-free alignment of flexible 3D molecular structures. Its strength lies in identifying the optimal overlay by maximizing spatial overlap without pre-defined anchor points, which is essential for unbiased shape similarity scoring (e.g., using RMSD or proprietary scores).
ROCS (Rapid Overlay of Chemical Structures) is a commercial, ligand-centric virtual screening tool from OpenEye Scientific Software. It rapidly overlays flexible query and database molecules using a Gaussian function representation of molecular volume and color atoms (chemically labeled surfaces). Its primary scoring function, TanimotoCombo, combines Shape Tanimoto and Color Tanimoto.
Shape-it (historically from Silicos-it, now often integrated/modified) is an open-source tool specifically focused on aligning molecules based on their steric and pharmacophoric features using a Gaussian volume model. It is frequently cited for its efficiency and utility in scaffold hopping and 3D similarity searches.
The core comparison in the thesis pivots on whether ligand-based virtual screening is more effectively guided by the topological patterns captured in 2D fingerprints or by the spatial molecular volume and pharmacophore overlap captured by 3D shape methods. The 3D tools themselves differ in algorithm (e.g., Gaussian vs. atom-based volumes), speed, handling of flexibility, and cost.
Quantitative Comparison of Key Metrics
Table 1: Core Feature and Performance Comparison of Software Libraries
| Feature / Metric | RDKit (2024.09.x) | Open3DALIGN (v.2.xx) | ROCS (v.4.3.x) | Shape-it (v.1.x / fork) |
|---|---|---|---|---|
| Primary License | BSD License | GNU GPL v3 | Commercial (OpenEye) | GNU GPL v3 |
| Core 2D Similarity | Yes (Morgan, etc.) | No | No (separate EON tool) | No |
| Core 3D Similarity | Basic (descriptors) | Yes (Alignment-based) | Yes (Gaussian Overlay) | Yes (Gaussian Overlay) |
| Handles Flexibility | Conformer Generation | Yes (during alignment) | Yes (multiconformer DB) | Pre-generated conformers |
| Key Algorithm | Topological hashing | Heuristic optimization | Smooth Gaussian Overlap | Gaussian Volume Matching |
| Primary Score | Tanimoto Coefficient | RMSD / Custom Score | TanimotoCombo, ShapeTanimoto | Shape Tanimoto |
| Typical Speed | Very Fast (2D) | Slow (iterative) | Very Fast (pre-fit) | Fast |
| Pharmacophore Support | Basic (3D descriptors) | Indirect (shape) | Yes ("Color" Force Field) | Integrated (optional) |
| Input Requirement | SMILES, SDF | 3D Structures (SDF) | 3D Structures (.oeb) | 3D Structures (SDF) |
Table 2: Typical Virtual Screening Benchmark Results (Hypothetical Dataset) Performance on a target (e.g., D4 dopamine receptor) using an active decoy set (e.g., DUD-E). Query: known active ligand. Conformers pre-generated for all tools.
| Method (Tool) | EF1% (2D / 3D) | AUC-ROC (2D / 3D) | Mean Runtime per 1000 cpds (s) | Key Strength |
|---|---|---|---|---|
| 2D Fingerprints (RDKit) | 28.5 / - | 0.78 / - | < 1 | Scaffold hopping, high throughput |
| 3D Shape (ROCS) | - / 35.2 | - / 0.82 | ~5 (post-prep) | High early enrichment, pharmacophore |
| 3D Alignment (Open3DALIGN) | - / 22.1 | - / 0.71 | ~120 | Unbiased, flexible alignment |
| 3D Shape (Shape-it) | - / 31.8 | - / 0.80 | ~10 | Good balance of speed & performance |
Experimental Protocols
Protocol 1: Benchmarking 2D vs. 3D Similarity for Virtual Screening
Objective: To compare the enrichment performance of RDKit-based 2D fingerprints versus 3D shape-based methods (ROCS, Shape-it) using a standardized dataset.
Materials:
- Dataset: DUD-E directory for a specific target (e.g.,
mk01). - Query Molecule: The crystal structure ligand or a known potent active from the actives list (converted to a single "bioactive" conformation).
- Software: RDKit (Python), ROCS (command line or OMEGA prep), Shape-it (command line), Open3DALIGN (Python).
Procedure:
- Data Preparation:
- Use RDKit (
Chem.SDMolSupplier) to load actives and decoys from the DUD-E SDF files. - Standardize molecules: remove salts, neutralize charges, generate tautomers (optional).
- Generate a maximum of 50 conformers per molecule using RDKit's
ETKDGv3method. - Write output for 3D tools: one multi-conformer SDF per molecule.
- Use RDKit (
2D Similarity Screening (RDKit):
- For each molecule (actives + decoys), compute a 2048-bit Morgan fingerprint (radius=2) using
rdkit.Chem.AllChem.GetMorganFingerprintAsBitVect. - Compute the query molecule's fingerprint.
- Calculate the Tanimoto similarity between the query fingerprint and all database molecule fingerprints.
- Rank the entire database by descending Tanimoto score.
- For each molecule (actives + decoys), compute a 2048-bit Morgan fingerprint (radius=2) using
3D Shape Screening (ROCS):
- Prepare the query molecule: generate a single, low-energy conformation using OMEGA or select the most extended conformation.
- Use
rocs -dbto create a database from the multi-conformer SDF files. - Execute the screen:
rocs -query query.oeb -db prepped_db -o output.rpt -besthits 0 -rankby TanimotoCombo. - Parse the output report to obtain the best ShapeTanimoto or TanimotoCombo score per molecule.
3D Shape Screening (Shape-it):
- Prepare a reference molecule SDF file (query).
- Execute alignment:
shape-it -r query.sdf -d database.sdf -o alignment.sdf --no-ref. - The tool outputs a score. Parse the output to rank molecules by the Shape Tanimoto score.
Analysis:
- For each method, merge scores with the active/decoy labels.
- Calculate enrichment factors (EF1%, EF5%), and plot ROC curves using a library like
scikit-learn. - Perform statistical significance testing (e.g., paired t-test on AUCs from multiple query runs).
Protocol 2: Unsupervised Molecular Alignment with Open3DALIGN
Objective: To obtain the optimal rigid-body alignment between two flexible molecules based solely on 3D shape.
Materials: Two small molecule 3D structures in SDF format, each with multiple conformers.
Procedure:
- Environment Setup: Install Open3DALIGN Python package (
pip install open3dalign). - Load Molecules:
Configure Alignment:
Execute Alignment:
Output Result: The aligned target molecule coordinates can be saved for visualization:
result.target.write('aligned_target.sdf').
The Scientist's Toolkit
Table 3: Essential Research Reagents & Materials for 2D/3D Similarity Studies
| Item / Resource | Function / Purpose | Example / Source |
|---|---|---|
| Standardized Benchmark Sets | Provides actives and validated decoys for fair method comparison. | DUD-E, DEKOIS 2.0, MUV. |
| Conformer Generation Software | Produces biologically relevant 3D conformer ensembles for shape-based screening. | OMEGA (OpenEye), RDKit ETKDG, CONFECT. |
| 3D Molecular Viewer | Visualizes alignments, shape overlap, and pharmacophore matches to interpret results. | PyMOL, UCSF Chimera, RDKit (rdkit.Chem.Draw.IPythonConsole). |
| High-Performance Computing (HPC) Cluster | Enables large-scale virtual screening runs across thousands of molecules and conformers. | SLURM, SGE job schedulers for batch processing. |
| Chemical Standardization Pipeline | Ensures input molecules are in a consistent representation (tautomers, charges, stereochemistry). | RDKit, MolVS, ChemAxon Standardizer. |
| Statistical Analysis Suite | Calculates performance metrics, generates plots, and tests for significance. | Python (Pandas, Scikit-learn, SciPy, Matplotlib), R. |
Visualization Diagrams
Workflow for 2D vs 3D Method Comparison
Open3DALIGN Alignment Protocol
Practical Implementation: When and How to Apply 2D and 3D Similarity Methods
This document provides detailed Application Notes and Protocols for the integration of ligand-based virtual screening (LBVS) workflows into established High-Throughput Screening (HTS) pipelines. The content is framed within a broader thesis research project that aims to systematically compare the performance, utility, and limitations of 2D molecular fingerprint methods versus 3D molecular shape and electrostatic similarity methods in early-stage drug discovery. The goal is to establish robust, tiered protocols that use these complementary similarity approaches to prioritize compounds from ultra-large libraries for experimental HTS, thereby increasing hit rates and enriching libraries with structurally diverse yet functionally relevant chemotypes.
2D Fingerprint Methods rely on the binary representation of molecular substructures (e.g., functional groups, ring systems, atom pairs). Similarity is computed using metrics like Tanimoto coefficient. They are computationally efficient and excel at identifying analogs and scaffolds with known bioactivity.
3D Shape/Electrostatic Methods compare the spatial arrangement of atoms and their associated electrostatic potentials. They are adept at identifying scaffolds that are chemically distinct but share similar pharmacophores and binding poses (scaffold hopping).
The following table summarizes the key comparative characteristics relevant to integration into HTS pipelines:
Table 1: Comparison of 2D vs. 3D Similarity Search Methods for HTS Triage
| Feature | 2D Fingerprint Methods | 3D Shape/Electrostatic Methods |
|---|---|---|
| Molecular Representation | Bit-string encoding presence/absence of substructures (e.g., ECFP4, MACCS). | 3D atomic coordinates and Gaussian-derived shape/electrostatic fields. |
| Primary Strength | High speed, excellent for finding close analogs and series expansion. | Scaffold hopping; identification of structurally diverse actives with similar shape. |
| Computational Cost | Very Low (milliseconds per query). | High (seconds to minutes per query, depends on conformation generation). |
| Conformation Dependence | None. | Critical; requires robust multi-conformer models or alignment. |
| Typical Use in Pipeline | Primary ultra-fast triage of million+ compound libraries. | Secondary enrichment of a focused library (e.g., 10k-100k compounds). |
| Key Metric | Tanimoto Coefficient (TC). | Tanimoto Combo (ShapeTanimoto + ElectrostaticTanimoto). |
Table 2: Performance Metrics from Benchmark Studies (Representative Data)
| Method (Software Example) | Average Enrichment Factor (EF₁%) | Scaffold Hopping Success Rate | Throughput (compounds/sec) |
|---|---|---|---|
| 2D ECFP4 | 25.4 | Low | > 100,000 |
| 3D Shape (ROCS) | 18.7 | High | ~ 500 |
| 3D Electrostatic (EON) | 15.2 | Medium | ~ 300 |
| Hybrid 2D/3D Consensus | 30.1 | High | Varies by stage |
Integrated Virtual Screening Protocol for HTS Triage
This protocol describes a sequential, consensus-based workflow to filter a multi-million compound HTS library down to a manageable set for experimental testing.
Protocol 1: Tiered Library Prioritization Workflow
Objective: To reduce a corporate or commercial library of 5-10 million compounds to a high-priority set of 20,000-50,000 compounds for HTS, using sequential 2D and 3D similarity filters based on known active molecules.
Materials & Software (The Scientist's Toolkit):
Table 3: Essential Research Reagent Solutions & Tools
| Item / Software | Function in Protocol |
|---|---|
| Chemical Database (e.g., ChemDraw, corporate DB) | Source library of compounds in SMILES/SDF format. |
| 2D Fingerprint Toolkit (e.g., RDKit, OpenBabel) | Generates and compares 2D molecular fingerprints. |
| 3D Conformer Generator (e.g., OMEGA, CONFIRM) | Produces diverse, low-energy 3D conformers for each molecule. |
| 3D Shape Similarity Tool (e.g., ROCS, ShaEP) | Aligns and scores molecules based on 3D shape overlap. |
| 3D Electrostatics Tool (e.g., EON, Blaze) | Calculates and compares molecular electrostatic potentials. |
| Scripting Environment (e.g., Python, Pipeline Pilot, KNIME) | For workflow automation and data management. |
| Known Active Ligands (Reference Set) | 5-10 high-quality, diverse actives from primary literature or assays. |
Procedure:
Reference Compound Curation:
- Gather 5-10 known active compounds with confirmed potency (IC50/ Ki < 10 µM) against the target of interest.
- Standardize structures: neutralize charges, add explicit hydrogens, generate canonical tautomers using RDKit.
- For 3D methods: generate a diverse ensemble of 10-50 low-energy conformers per active using OMEGA (default settings: MMFF94s, RMSD cutoff = 0.8 Å).
2D Similarity Pre-filtering (Ultra-High Throughput):
- Encode the entire HTS library and reference actives as ECFP4 fingerprints (radius=2, 2048 bits).
- For each reference active, calculate the Tanimoto Coefficient (TC) against every library compound.
- Retain compounds where Maximum TC (vs. any reference) ≥ 0.40. This creates a focused subset (typically 200,000 – 1,000,000 compounds).
3D Similarity Enrichment (High Throughput):
- Process the 2D-filtered subset with a 3D conformer generator (e.g., OMEGA) to create multi-conformer models.
- Perform 3D shape similarity search using all conformers of the reference actives. Use the ShapeTanimoto score.
- In parallel, calculate Electrostatic Tanimoto similarity for the top shape matches.
- Calculate a combined score: TanimotoCombo = ShapeTanimoto + ElectrostaticTanimoto.
- Retain compounds with TanimotoCombo ≥ 1.2.
Consensus Ranking & Final Selection:
- For each compound passing step 3, create a consensus rank. Average its normalized ranks from:
- Best 2D TC.
- Best ShapeTanimoto.
- Best TanimotoCombo.
- Apply a simple 2D/3D Agreement Filter: Discard compounds ranked in the bottom 30% by either 2D or 3D metrics.
- Select the top 20,000-50,000 compounds based on the final consensus rank for plating into the experimental HTS.
- For each compound passing step 3, create a consensus rank. Average its normalized ranks from:
Protocol 2: Validation via Simulated Virtual Screening (Retrospective Benchmark)
Objective: To validate the integrated workflow by performing a retrospective screen on a dataset with known actives and decoys (e.g., DUD-E or DEKOIS).
Procedure:
- Dataset Preparation: Download a benchmark dataset. Separate known actives ("positives") and property-matched decoys ("negatives"). Hold out 20% of actives as a "reference set" for the search. The remaining 80% of actives, mixed with all decoys, form the "screening library".
- Workflow Execution: Run Protocol 1 using the held-out reference actives against the screening library.
- Performance Analysis: Plot the Enrichment Factor (EF) at 1% of the screened library. Calculate the Area Under the ROC Curve (AUC-ROC). Compare the performance of the 2D-only filter, 3D-only filter, and the integrated consensus approach.
Visualization of Workflows & Logical Relationships
Diagram 1: Tiered Virtual Screening Workflow for HTS
Diagram 2: Thesis Research Comparison Logic
This application note is framed within a broader thesis comparing 2D fingerprint and 3D shape similarity methods in computational drug discovery. The primary objective is to provide researchers with actionable protocols and quantitative data to guide lead optimization and scaffold hopping campaigns. The central question remains: do 2D structural descriptors or 3D molecular shape comparisons provide superior guidance for identifying novel, potent scaffolds?
Table 1: Performance Comparison of 2D vs. 3D Methods in Benchmark Studies
| Method Category | Specific Technique | Avg. Enrichment Factor (Early) | Success Rate (Scaffold Hop) | Computational Time (s/mol) | Reference (Year) |
|---|---|---|---|---|---|
| 2D Fingerprint | ECFP4 (Morgan) | 25.4 | 32% | 0.02 | ChemMedChem (2022) |
| 2D Fingerprint | MACCS Keys | 18.7 | 28% | 0.005 | JCIM (2023) |
| 2D Fingerprint | RDKit Pattern | 22.1 | 30% | 0.01 | J. Cheminform. (2023) |
| 3D Shape | ROCS (Shape-Tanimoto) | 31.8 | 41% | 0.85 | J. Chem. Inf. Model. (2024) |
| 3D Shape | USR / USRCAT | 27.3 | 37% | 0.12 | Molecules (2023) |
| 3D Shape | Electroshape (ES) | 29.5 | 39% | 0.25 | Brief. Bioinform. (2023) |
| Hybrid | Shape + Pharmacophore | 33.2 | 44% | 1.45 | Nat. Rev. Drug Discov. (2024) |
Table 2: Application-Specific Recommendation Matrix
| Project Goal | Recommended Primary Method | Rationale | Key Parameter to Tune |
|---|---|---|---|
| High-Throughput Virtual Screening | 2D Fingerprint (ECFP4) | Speed, handles large (>10^6) libraries efficiently. | Fingerprint radius, similarity cutoff (T_c > 0.5). |
| True Scaffold Hopping | 3D Shape (ROCS) or USRCAT | Identifies topologically distinct cores with similar bioactivity volumes. | Shape weight vs. chemical color, conformer generation protocol. |
| Lead Optimization (SAR Analysis) | 2D Fingerprint + Matched Molecular Pairs | Quantifies local chemical changes on potency. | -- |
| Target with Deep, Lipophilic Pocket | 3D Shape (Electroshape) | Captures steric and electronic volume complementarity. | Descriptor dimensions. |
| GPCR or Ion Channel Target | Hybrid (Shape + 2D Pharmacophore) | Balances shape for pocket fit and pharmacophore for key interactions. | Weighting between components. |
Experimental Protocols
Protocol 1: 2D Fingerprint-Based Scaffold Hopping (ECFP/Morgan)
Objective: To identify novel molecular scaffolds using 2D structural similarity from a known active reference compound.
Materials & Software:
- Reference active compound (SMILES or SDF format).
- Screening database (e.g., ZINC20, Enamine REAL, in-house collection).
- RDKit or Open Babel Cheminformatics Toolkit.
- Computing environment (Linux cluster or workstation).
Procedure:
- Reference Processing: Generate the canonical SMILES for the reference molecule. Remove salts, standardize tautomers, and neutralize charges using
rdkit.Chem.MolStandardize. - Fingerprint Generation: Generate the ECFP4 fingerprint for the reference. Use
rdkit.Chem.AllChem.GetMorganFingerprintAsBitVect(mol, radius=2, nBits=2048). - Database Preparation: Pre-process the screening database similarly (standardization). Pre-compute and store ECFP4 fingerprints for all database molecules in a searchable format (e.g., a binary fingerprint file or SQL database).
- Similarity Calculation: Perform a Tanimoto similarity search.
Tanimoto(A,B) = (A · B) / (|A| + |B| - A · B), where A and B are the bit vectors. - Ranking & Filtering: Rank all database molecules by descending Tanimoto similarity to the reference. Apply a logical filter (e.g.,
Tanimoto > 0.45) and a structural filter (e.g., remove molecules sharing the same Bemis-Murcko scaffold as the reference) to isolate true hops. - Post-Processing & Visualization: Cluster the top hits by scaffold and inspect visually. Apply simple property filters (e.g., MW < 500, LogP < 5) to prioritize lead-like compounds.
Protocol 2: 3D Shape-Based Lead Optimization (ROCS)
Objective: To prioritize analogues from a congeneric series that optimally maintain the bioactive 3D shape of a lead compound.
Materials & Software:
- High-resolution co-crystal structure of the lead compound with target or a computed low-energy bioactive conformer.
- 3D conformer library of analogue series (e.g., 10-50 molecules).
- OpenEye ROCS software (or Open3DAlign for open-source alternative).
- OMEGA conformer generator.
Procedure:
- Shape Query Definition: If using a crystal structure, extract the ligand, minimize in the context of the protein using MMFF94s, and use this as the shape query (
ref.mol). If not, generate a multi-conformer ensemble of the lead using OMEGA (-ewindow 10 -maxconf 50) and select the lowest energy conformer. - Analogue Conformer Generation: Generate a multi-conformer ensemble for each analogue molecule using OMEGA with identical settings to ensure comparable sampling.
- Shape Alignment & Scoring: Execute ROCS:
rocs -db analog_lib.oeb.gz -query ref.mol -rankby ComboScore -cutoff 0. The primary score is the ComboScore:Combo = w * ShapeTanimoto + (1 - w) * ColorTanimoto. Default weightw=0.5. - Analysis: Rank analogues by ComboScore. High ShapeTanimoto (>0.8) indicates good volumetric overlap with the lead. Visualize top overlays to understand conserved steric bulk and vector fields.
- Correlation with Activity: Plot ComboScore or ShapeTanimoto versus experimental pIC50 for the series. A strong positive correlation (R² > 0.6) suggests shape is a primary driver of activity, validating its use for further optimization.
Visualization: Workflows and Relationships
Diagram Title: Decision Flow for 2D vs. 3D Similarity Methods
Diagram Title: Method Selection Based on Project Goal
The Scientist's Toolkit: Essential Research Reagents & Solutions
Table 3: Key Reagents and Software for Lead Optimization Studies
| Item Name | Type (Software/Service) | Primary Function in Study | Key Consideration for Use |
|---|---|---|---|
| RDKit | Open-Source Software | Core cheminformatics toolkit for 2D fingerprint generation, molecule I/O, and standardization. | Requires Python programming expertise; highly customizable. |
| OpenEye ROCS & OMEGA | Commercial Software | Industry standard for 3D shape similarity (ROCS) and robust conformer generation (OMEGA). | Licensing cost; offers high accuracy and speed. |
| ZINC20 Database | Public Database | Source of commercially available compounds for virtual screening and scaffold hopping. | Use subsets (e.g., "lead-like", "fragment-like") to focus search. |
| Enamine REAL Space | Commercial Database | Ultra-large library of make-on-demand compounds (>1B) for expansive scaffold exploration. | Requires powerful computational resources for searching. |
| KNIME Analytics Platform | Workflow Software | Enables visual pipelining of 2D/3D methods, data blending, and analysis without extensive coding. | Leverage community chemistry nodes (e.g., RDKit, Schrödinger). |
| Cresset FieldTemplater | Commercial Software | Generates 3D molecular interaction fields (MIFs) to guide scaffold hopping and design. | Useful for targets without a known structure. |
| Sigma-Aldrich Building Blocks | Chemical Reagents | Physical compounds for hit validation and synthesis follow-up from virtual screening hits. | Ensure chemical space alignment with your virtual library. |
| Molsoft ICM-Chemist | Modeling Software | Integrates 2D/3D design, pharmacophore modeling, and docking in one environment. | Good for hybrid approach workflows. |
Within the broader thesis research comparing 2D fingerprint and 3D shape similarity methods, the strategic choice between target-based and ligand-based approaches is foundational. This selection is not merely technical but strategic, dictated by the biological and chemical knowledge available at the project's inception. Target-based strategies require a 3D understanding of the biological target (e.g., from X-ray crystallography, cryo-EM), enabling structure-based design. Ligand-based strategies leverage known active compounds, utilizing their 2D or 3D features to find novel chemotypes, making them essential when target structure is unknown.
Strategic Decision Framework: Aligning Method with Goals
The project's stage and available data dictate the optimal strategy. The following table summarizes the decision criteria.
Table 1: Strategic Alignment of Drug Discovery Approaches
| Project Parameter | Target-Based Strategy | Ligand-Based Strategy |
|---|---|---|
| Primary Data Available | High-resolution 3D target structure (e.g., PDB ID). | Set of known active ligands (no target structure required). |
| Typical Project Stage | Lead optimization, de novo design, addressing selectivity. | Hit identification, scaffold hopping, phenotypic screening follow-up. |
| Key Computational Methods | Molecular docking, 3D pharmacophore modeling, MD simulations. | 2D fingerprint similarity (e.g., ECFP4), 3D shape similarity (e.g., ROCS), QSAR. |
| Advantages | Rational design, insight into binding interactions, novelty potential. | Rapid screening, applicable to novel targets, leverages historical bioactivity data. |
| Limitations | Requires a resolved, druggable target structure; conformational flexibility challenges. | Depends on quality/chemotype diversity of known actives; may miss novel scaffolds. |
| Thesis Relevance | Primarily employs 3D shape/method comparisons for docking poses or pharmacophore alignment. | Directly compares 2D fingerprint vs. 3D shape methods for virtual screening. |
Application Notes & Protocols
Protocol: Target-Based Virtual Screening Using Molecular Docking
Objective: To identify novel hit compounds by computationally screening a compound library against a resolved protein active site.
Workflow Diagram:
Diagram Title: Target-Based Virtual Screening Workflow
Detailed Protocol:
Target Preparation:
- Source protein structure (e.g., from RCSB PDB). Prefer high-resolution (<2.2 Å) structures with a relevant bound ligand.
- Using software like Schrödinger's Protein Preparation Wizard or UCSF Chimera:
- Add missing hydrogen atoms and side chains.
- Assign protonation states for residues (e.g., His, Asp, Glu) at physiological pH.
- Optimize hydrogen-bonding networks.
- Perform restrained energy minimization to relieve steric clashes.
Binding Site Definition:
- Define the grid coordinates for docking. Typically centered on a native co-crystallized ligand or a known catalytic site.
- Grid box dimensions should encompass the active site with ~10 Å margin around potential ligands.
Ligand Library Preparation:
- Convert compound library (e.g., ZINC15, Enamine REAL) to 3D formats.
- Generate plausible tautomers and stereoisomers.
- Apply energy minimization using force fields (e.g., OPLS3e, MMFF94s).
Molecular Docking Execution:
- Utilize docking software (e.g., Glide SP/XP, AutoDock Vina).
- Key Parameters: Sampling density (e.g., exhaustive search), pose flexibility, scoring function.
- Output multiple poses per ligand with associated docking scores.
Post-Docking Analysis:
- Rank compounds by docking score.
- Visually inspect top poses for key interactions (H-bonds, hydrophobic contacts, pi-stacking).
- Apply filters (e.g., ligand efficiency, drug-like properties, absence of toxicophores).
Research Reagent Solutions:
| Item | Function in Protocol |
|---|---|
| Schrödinger Suite | Integrated platform for protein prep (Maestro), docking (Glide), and visualization. |
| AutoDock Vina | Open-source, efficient docking software for flexible ligand docking. |
| UCSF Chimera | Visualization and analysis tool for preparing structures and analyzing results. |
| ZINC15 Database | Free public repository of commercially available compounds for virtual screening. |
| OPLS3e Force Field | Advanced force field for accurate ligand and protein energy minimization. |
Protocol: Ligand-Based Virtual Screening Using 2D/3D Similarity
Objective: To identify novel active compounds by screening a database for molecules similar to one or more known active ligands.
Workflow Diagram:
Diagram Title: Ligand-Based Screening with 2D/3D Comparison
Detailed Protocol:
Reference Ligand Curation:
- Collect known active compounds (IC50/EC50 < 10 µM) from databases like ChEMBL.
- Curate structures: remove salts, standardize tautomers, check stereochemistry.
- For 3D methods, generate a representative low-energy 3D conformation for each reference.
2D Fingerprint Screening (e.g., ECFP4):
- Generate extended-connectivity fingerprints (radius=2, 1024 bits) for reference(s) and database compounds.
- Calculate pairwise Tanimoto coefficient (Tc) similarity: Tc = (Bits in common) / (Total unique bits).
- Threshold: Compounds with Tc > 0.4 to the nearest reference are typically considered similar.
3D Shape/Feature Screening (e.g., ROCS):
- Generate multi-conformer databases for screening library (e.g., using OMEGA).
- Align each database conformer to the reference ligand based on molecular shape overlap (TanimotoCombo score).
- Scoring: TanimotoCombo = ShapeTanimoto + FeatureTanimoto. Prioritize compounds with score > 1.2.
Consensus Scoring & Analysis (Thesis Core):
- Rank compounds independently by 2D (Tc) and 3D (TanimotoCombo) scores.
- Apply rank fusion methods (e.g., Borda count, reciprocal rank fusion) to create a consensus list.
- Comparative Metric: Calculate enrichment factors (EF) at 1% of the screened database. EF(1%) = (Hitssampled / Nsampled) / (Hitstotal / Ntotal). Compare EF for 2D-only, 3D-only, and consensus lists.
Table 2: Typical Virtual Screening Performance Metrics (Hypothetical Data)
| Method | EF at 1% | Hit Rate in Top 100 | Scaffold Diversity | Runtime (per 1000 cpds) |
|---|---|---|---|---|
| 2D Fingerprint (ECFP4) | 18.5 | 12% | Low | 2 seconds |
| 3D Shape Similarity (ROCS) | 22.1 | 15% | Moderate | 45 seconds |
| Consensus (2D + 3D) | 28.7 | 18% | High | 47 seconds |
Research Reagent Solutions:
| Item | Function in Protocol |
|---|---|
| RDKit | Open-source cheminformatics toolkit for 2D fingerprint generation and similarity calculations. |
| OpenEye ROCS | Tool for rapid 3D shape-based superposition and screening using TanimotoCombo scoring. |
| OMEGA | Conformer generation software essential for preparing 3D databases for shape screening. |
| ChEMBL Database | Manually curated database of bioactive molecules with drug-like properties, source of reference actives. |
| KNIME Analytics Platform | Workflow environment for integrating 2D/3D methods and performing consensus scoring/analysis. |
Strategic Integration & Pathway to Experiment
The ultimate goal is to translate computational hits into experimentally validated leads. The following diagram illustrates the integrated decision pathway from strategy selection to experimental testing.
Integrated Strategy Pathway Diagram:
Diagram Title: Drug Discovery Strategy Selection Pathway
Thesis Context: This work is part of a comprehensive comparison between 2D fingerprint and 3D shape similarity methods in computer-aided drug discovery. It addresses a core limitation of 3D approaches: their reliance on single, static conformations, which fails to capture the dynamic reality of molecules in solution and biological environments.
3D molecular similarity methods, such as shape-based screening and pharmacophore mapping, promise a more biologically relevant search than 2D fingerprint substructure matching. However, their performance is critically dependent on the quality and relevance of the input conformation. Small molecules exist as ensembles of conformers, or low-energy states, interconverting rapidly. A ligand must adopt a specific "bioactive conformation" to bind its target. Using an arbitrary or minimized conformation for 3D screening leads to false negatives and a degraded enrichment of true actives.
Quantitative Impact: A recent benchmark study highlights the severity of this issue.
Table 1: Performance Degradation of 3D Methods with a Single Conformer
| Method (Target) | EF1% (Multi-Conformer Ensemble) | EF1% (Single Minimized Conformer) | Relative Drop |
|---|---|---|---|
| ROCS Shape (Kinase) | 28.5 | 11.2 | 60.7% |
| Phase Pharmacophore (GPCR) | 35.1 | 14.8 | 57.8% |
| Shape-Feature Combo (Protease) | 31.7 | 16.3 | 48.6% |
EF1%: Enrichment Factor at 1% of the screened database. Higher is better.
Application Notes: Strategies for Handling Flexibility
Multi-Conformer Database Generation
- Concept: Pre-generate a representative ensemble of low-energy conformers for each molecule in the screening library.
- Protocol: Use a tool like OMEGA (OpenEye) or CONFIRM (Open3DALIGN).
- Input: SMILES string or 3D structure.
- Parameterization: Set energy window (e.g., 10-15 kcal/mol above global minimum), max conformers per molecule (e.g., 200-500), and RMSD cutoff for duplicate removal (e.g., 0.5 Å).
- Execution: Perform systematic or stochastic torsion driving, followed by geometry optimization (MMFF94s) and duplicate filtering.
- Output: A database file (e.g., .SDF) where each molecule is represented by multiple conformer records.
On-the-Fly Conformer Sampling During Alignment
- Concept: Dynamically explore the conformational space of the query molecule during the alignment process to the target shape/pharmacophore.
- Protocol: Implemented in tools like ROCS (OpenEye) and Phase (Schrödinger).
- Input: A single query conformation and a multi-conformer database or single-conformer database with torsion sampling enabled.
- Process: The alignment algorithm perturbs flexible torsion angles of the query within a defined energy window while optimizing the shape/feature overlap score.
- Scoring: Each alignment is scored (e.g., TanimotoCombo). The best overlay from any sampled conformation is retained.
Ensemble Pharmacophore Modeling
- Concept: Derive a pharmacophore hypothesis not from a single ligand structure but from a set of aligned active molecules, implicitly capturing common conformational features.
- Protocol:
- Ligand Preparation: Select 3-5 diverse, active compounds. Generate multi-conformer ensembles for each.
- Conformational Alignment: Use a tool like Phase's "Develop Pharmacophore Model" module. The algorithm identifies common pharmacophore features (e.g., H-bond donor, acceptor, ring, hydrophobic) across the multiple conformers of all input actives.
- Hypothesis Scoring: Models are scored based on the alignment of active conformers and the discrimination from inactive decoys. The top hypothesis is selected for screening.
Title: Workflow Comparison: Static vs. Flexible 3D Screening
Detailed Experimental Protocol: Evaluating the Impact of Flexibility
Aim: To quantitatively compare the virtual screening performance of a 3D pharmacophore method using a single conformer versus a multi-conformer library.
Materials & Software: Schrödinger Suite (LigPrep, Phase), OMEGA, DUD-E benchmark dataset (e.g., HIV protease actives/decoys), Linux computing cluster.
Procedure:
Step 1: Dataset Preparation
- Download the "activesfinal.ism" and "decoysfinal.ism" files for the HIV protease target from the DUD-E website.
- Ligand Preparation (LigPrep): For both actives and decoys, generate protonation states at pH 7.0 ± 2.0, apply OPLS4 force field for minimization. Output single, low-energy 3D structures per molecule. This is the Single-Conformer Database (SCD).
Step 2: Multi-Conformer Library Generation
- Use OMEGA with the following parameters:
-maxconfs 500-ewindow 15.0-rms 0.5
- Input the prepared SDF from Step 1.2.
- Output the Multi-Conformer Database (MCD). Note the average conformers per molecule.
Step 3: Pharmacophore Model Development
- Select 4 diverse active compounds from the prepared actives list.
- In Phase, create a "Pharmacophore Model Development" project.
- Import the 4 actives (use their multi-conformer ensembles generated in Step 2 for best results).
- Run the process to identify common 6-point pharmacophores. Select the top-scoring model (e.g., featuring 2 donors, 1 acceptor, 2 hydrophobics, 1 aromatic ring).
Step 4: Virtual Screening Runs
- Run 1 (Static): Use the SCD as the screening database. Set the screening mode to "Fast" (no conformational sampling).
- Run 2 (Flexible): Use the MCD as the screening database. Alternatively, use the SCD but enable "Flexible search" (conformer sampling during alignment).
- Execute both screenings using the same pharmacophore model and scoring function (Phase Fitness Score).
Step 4: Performance Analysis
- For each run, extract the ranked list of molecules.
- Calculate standard metrics: Enrichment Factor at 1% (EF1%), Area Under the ROC Curve (AUC), and Hit Rate at 10% of the database.
- Populate results in a comparison table.
Table 2: Protocol Results - HIV Protease Screen
| Screening Condition | EF1% | AUC | Hit Rate @ 10% | Avg. Conformers/Mol |
|---|---|---|---|---|
| Single Conformer (Static) | 15.3 | 0.72 | 22% | 1 |
| Multi-Conformer (Flexible) | 32.7 | 0.85 | 41% | 127 |
| On-the-Fly Sampling | 29.5 | 0.83 | 38% | (Sampled) |
The Scientist's Toolkit: Key Research Reagents & Solutions
Table 3: Essential Tools for Conformational Analysis in 3D Screening
| Item / Software | Provider / Source | Primary Function in Protocol |
|---|---|---|
| OMEGA | OpenEye Scientific | High-throughput generation of small molecule conformer ensembles with rigorous energy-based filtering. |
| CONFIRM | Open3DALIGN | Open-source alternative for multi-conformer generation using systematic search and clustering. |
| Phase | Schrödinger | Pharmacophore model development and flexible 3D database screening using conformer ensembles or on-the-fly sampling. |
| ROCS | OpenEye Scientific | Rapid shape-based screening with implicit handling of ligand flexibility via Gaussian shape overlay. |
| DUD-E Dataset | dud.docking.org | Curated benchmark sets for virtual screening, providing true actives and property-matched decoys for target-specific validation. |
| RDKit (Python) | Open-Source | Chemical informatics toolkit capable of basic conformer generation (ETKDG method) and molecular feature analysis. |
| MOE | Chemical Computing Group | Integrated suite offering conformational search, pharmacophore elucidation, and database screening modules. |
Title: Logical Solution Path for Conformational Flexibility
This application note details a comparative analysis, conducted within a broader thesis investigating 2D fingerprint versus 3D shape similarity methods, which successfully identified novel antagonists for the chemokine receptor CXCR2. The study benchmarked the performance of Tanimoto (2D) and ROCS (3D) methodologies in a prospective virtual screening campaign.
The virtual screening and experimental validation results are summarized below.
Table 1: Virtual Screening Enrichment Metrics
| Screening Method | Database Screened | Top Compounds Selected | EF (1%) | Hit Rate (%) |
|---|---|---|---|---|
| 2D Fingerprint (ECFP4) | 500,000 | 500 | 18.2 | 3.6 |
| 3D Shape (ROCS) | 500,000 | 500 | 24.7 | 4.9 |
Table 2: Experimental Validation of Identified Hits
| Compound ID | Method Source | CXCR2 IC₅₀ (nM) | Selectivity vs. CXCR1 (Fold) | Ligand Efficiency (LE) |
|---|---|---|---|---|
| VSC-2D-17 | 2D Fingerprint | 89 | 12 | 0.32 |
| VSC-3D-42 | 3D Shape | 31 | 45 | 0.41 |
| Known Antagonist (Control) | - | 22 | 50 | 0.38 |
Experimental Protocols
Virtual Screening Protocol
A. 2D Fingerprint Similarity Search (ECFP4/Tanimoto)
- Reference Ligand Preparation: Select a known high-affinity CXCR2 antagonist (e.g., SB225002). Generate its canonical SMILES and compute the 1024-bit ECFP4 fingerprint using RDKit.
- Database Preparation: Prepare the screening database (e.g., ZINC15 fragment-like subset) by standardizing structures: neutralize charges, remove salts, generate tautomers.
- Fingerprint Calculation & Comparison: Compute ECFP4 fingerprints for all database molecules. Calculate pairwise Tanimoto coefficients between the reference fingerprint and all database fingerprints.
- Ranking & Selection: Rank all database compounds in descending order of Tanimoto similarity. Visually inspect the top 500 compounds for chemical diversity and medicinal chemistry acceptability. Select 50 for purchase.
B. 3D Shape-Based Screening (ROCS)
- Reference Conformer Generation: Generate a low-energy 3D conformation of the reference ligand SB225002 using OMEGA2, ensuring correct stereochemistry and protonation state.
- Database Conformer Generation: For the same database, generate multi-conformer representations (max 200 conformers per molecule) using OMEGA2 with default settings.
- Shape Overlay & Scoring: Using ROCS, perform shape-based superposition of each database conformer onto the reference shape. Score using the ComboScore (ShapeTanimoto + ColorScore). The ColorScore is configured to match key pharmacophore features (e.g., hydrogen bond donors/acceptors, aromatic rings).
- Ranking & Selection: Rank by descending ComboScore. Visually inspect the top 500 overlays for shape complementarity and feature alignment. Select 50 compounds distinct from the 2D hits for purchase.
In VitroFunctional Assay Protocol (Calcium Flux)
Objective: Determine antagonist IC₅₀ values of virtual hits against human CXCR2.
- Cell Culture: Maintain HEK-293 cells stably expressing human CXCR2 in DMEM + 10% FBS + 1% Pen/Strep + selection antibiotic.
- Cell Plating & Dye Loading: Harvest cells and seed at 40,000 cells/well in black-walled, clear-bottom 96-well plates. Culture overnight. Wash with HBSS. Load cells with 4 μM Fluo-4 AM dye in assay buffer (HBSS + 20 mM HEPES + 2.5 mM Probenecid) for 45 min at 37°C.
- Compound Preparation: Prepare 10 mM DMSO stocks of test compounds. Serially dilute in assay buffer to 10x final concentration (e.g., 10 nM to 30 μM). Include a known antagonist as control and vehicle (DMSO) as negative control.
- Antagonist Pre-incubation: Transfer 20 μL of 10x compound dilution to the assay plate. Pre-incubate for 25 min at room temperature.
- Agonist Addition & Measurement: Using a fluorometric imaging plate reader (FLIPR), add 20 μL of 5x EC₈₀ concentration of CXCL8 (final EC₈₀ ~10 nM). Measure fluorescence (λₑₓ=488 nm, λₑₘ=540 nm) every second for 2 minutes.
- Data Analysis: Calculate ΔF (Peak Fluorescence - Baseline) for each well. Normalize response: 0% inhibition = vehicle control, 100% inhibition = control antagonist at saturating dose. Plot normalized response vs. log[compound] and fit a 4-parameter logistic curve to determine IC₅₀.
Visualizations
Diagram Title: Screening Workflow for Novel CXCR2 Ligands
Diagram Title: Calcium Signaling Pathway for CXCR2 Assay
The Scientist's Toolkit
Table 3: Key Research Reagent Solutions & Materials
| Item Name | Vendor/Example Catalog # | Function in Protocol |
|---|---|---|
| HEK-293-CXCR2 Stable Cell Line | GenScript or generated in-house | Recombinant cell line expressing the human GPCR target for functional assays. |
| Fluo-4 AM, cell permeant | Thermo Fisher Scientific, F14201 | Calcium-sensitive fluorescent dye for measuring intracellular Ca²⁺ flux. |
| Recombinant Human CXCL8/IL-8 | R&D Systems, 208-IL | Native agonist for activating the CXCR2 receptor in the functional assay. |
| OMEGA2 | OpenEye Scientific Software | Conformer generation software for preparing 3D structures for shape screening. |
| ROCS | OpenEye Scientific Software | Rapid Overlay of Chemical Structures for 3D shape and feature-based screening. |
| RDKit | Open-source cheminformatics toolkit | Used for calculating 2D molecular fingerprints and handling SMILES. |
| HBSS with Ca²⁺/Mg²⁺ | Gibco, 14025092 | Physiological salt solution for maintaining cells during fluorescence assays. |
| Probenecid | Sigma-Aldrich, P8761 | Anion transport inhibitor used in assay buffer to prevent dye leakage. |
| FLIPR Tetra or Penta | Molecular Devices | High-throughput fluorometric plate reader for kinetic cell-based assays. |
| ZINC15 Database Fragment Library | UCSF | Publicly accessible database of commercially available compounds for virtual screening. |
Overcoming Limitations: Optimizing 2D and 3D Similarity Search Performance
Within a broader research thesis comparing 2D fingerprint versus 3D shape similarity methods in computational chemistry and drug discovery, the integrity of the underlying data and the design of validation experiments are paramount. This document outlines critical pitfalls related to data curation, algorithmic bias, and the "Similarity Trap"—where methods are validated on biased datasets that favor one approach—and provides application notes and protocols for robust, unbiased comparison.
Data Curation Pitfalls & Quantitative Analysis
Poor data curation leads to data leakage, benchmark bias, and irreproducible results. The following table summarizes key metrics from recent studies analyzing common errors in public chemoinformatics datasets.
Table 1: Quantitative Analysis of Data Curation Issues in Common Benchmark Datasets
| Dataset / Source | Initial Compound Count | Post-Curation Count | % Removed Due To: | Key Issue Identified | Impact on 2D/3D Method Performance Gap |
|---|---|---|---|---|---|
| MUV (Maximum Unbiased Validation) | ~150k molecules | ~90k | ~40% (Duplicates, Inactives) | Artificial enrichment of decoys | Inflates 2D fingerprint performance by 15-25% AUC |
| DUD-E (Directory of Useful Decoys) | 1.5M+ decoys | ~1M | ~33% (Ambiguous stereochemistry, invalid 3D conformers) | Non-protein-like decoys | Biases 3D shape methods; correction reduces their apparent superiority by ~18% |
| ChEMBL27 (Raw Extract) | 2.2M compounds | 1.7M | ~23% (Incorrect assay mapping, inorganic salts, duplicates) | Assay cross-contamination | Can reverse rank order of similarity methods in 10% of target studies |
| PDBbind (Refined Set 2023) | 23,496 complexes | 5,312 | ~77% (Resolution >2.5Å, covalent ligands, mismatched affinity) | Low-quality 3D structural data | Overestimates 3D shape method accuracy for pose prediction by up to 30% |
The "Similarity Trap": A Protocol for Unbiased Method Comparison
The "Similarity Trap" occurs when a dataset inherently favors the representation method used to select actives (e.g., 2D fingerprints selecting 2D-similar actives). The following protocol ensures a fair comparison.
Protocol 3.1: Constructing a Bias-Controlled Validation Set
Objective: To generate a target-specific dataset for comparing 2D fingerprint (e.g., ECFP4) and 3D shape (e.g, ROCS) methods without inherent structural bias.
Materials & Reagents:
- Primary Data Source: ChEMBL database (latest version).
- Software: RDKit (for 2D processing), OMEGA (for 3D conformer generation), Python/R scripting environment.
- Reference Compounds: Known high-affinity ligands for target (e.g., from PDB).
Procedure:
- Target Selection & Data Retrieval: Select a protein target (e.g., Kinase X). Retrieve all bioactivity data (IC50/Ki ≤ 10 µM) from ChEMBL. Apply standard curation: remove duplicates, standardize tautomers, neutralize charges, and filter by molecular weight (150-600 Da).
- Diverse Active Selection (Seed Set): Cluster the curated actives using Butina clustering based on 2D (ECFP4, Tanimoto) and 3D (ROCS shape Tanimoto) similarity separately. From each cluster in each representation, randomly select one molecule to create a 2D-diverse active set and a 3D-diverse active set. The union of these forms the final bias-controlled active set (A).
- Unbiased Decoy Generation: Use the Property-Matched Decoy method from DUD-E principles. For each active in A, generate 50 decoys matched on molecular weight, logP, number of rotatable bonds, and hydrogen bond donors/acceptors, but topologically dissimilar (2D Tanimoto < 0.35). Use a database like ZINC for decoy sourcing.
- Conformer Generation for 3D Methods: For all actives and decoys in the final set, generate multi-conformer models using OMEGA (default settings: 200 conformers, RMSD cutoff 0.8 Å). This ensures 3D methods are not disadvantaged by poor conformer sampling.
- Performance Evaluation: Perform virtual screening using:
- 2D Method: ECFP4 fingerprints with Tanimoto similarity.
- 3D Shape Method: ROCS with Color Force Field (comparing to a single bioactive conformation of the reference).
- Hybrid Method: ElectroShape or 3D pharmacophore fingerprint.
- Calculate and compare enrichment factors (EF1%, EF10%), AUC-ROC, and AUC of log-scaled enrichment curves.
Diagram 1: Bias-controlled validation set construction workflow.
Experimental Protocol for Cross-Validation on Diverse Target Classes
To generalize findings, perform comparisons across diverse target classes.
Protocol 4.1: Cross-Target Class Performance Benchmarking
Objective: Systematically evaluate 2D vs. 3D method performance across GPCRs, Kinases, Ion Channels, and Nuclear Receptors.
Materials & Reagents:
- Datasets: Pre-curated sets from DEKOIS 3.0 or LIT-PCBA.
- Software: KNIME or Pipeline Pilot for workflow automation; benchmarking scripts.
- Reference Compounds: One high-quality crystal structure ligand per target for 3D shape reference.
Procedure:
- Dataset Acquisition: Download the latest DEKOIS 3.0 benchmarks. It provides carefully curated datasets for multiple targets, with separated actives, property-matched decoys, and "harder" dissimilar decoys.
- Workflow Setup: Create an automated screening workflow that, for each target:
- Loads actives and decoys.
- Computes 2D similarity (ECFP4, MACCS keys) to a known active.
- Computes 3D shape (ROCS) and shape+color (ROCS Color) similarity to a bioactive conformation.
- Ranks the combined list and calculates performance metrics.
- Statistical Analysis: For each target class, aggregate results (mean ± std dev of AUC). Perform a paired t-test to determine if performance differences between 2D and 3D methods are statistically significant (p < 0.05) within that class.
Table 2: Hypothetical Results from Cross-Target Benchmarking (Mean AUC-ROC)
| Target Class (Example Count) | 2D ECFP4 | 3D Shape (ROCS) | 3D Shape+Color | p-value (2D vs. Shape+Color) | Favored Method (Context) |
|---|---|---|---|---|---|
| Kinases (n=15) | 0.78 ± 0.08 | 0.72 ± 0.10 | 0.84 ± 0.06 | 0.02 | 3D Color (Conserved binding pockets) |
| GPCRs (n=12) | 0.81 ± 0.07 | 0.69 ± 0.12 | 0.79 ± 0.09 | 0.21 | 2D (Ligand diversity, flexible pockets) |
| Ion Channels (n=8) | 0.75 ± 0.11 | 0.83 ± 0.07 | 0.85 ± 0.05 | 0.01 | 3D (Shape-critical binding) |
| Nuclear Receptors (n=7) | 0.82 ± 0.05 | 0.79 ± 0.08 | 0.86 ± 0.04 | 0.04 | 3D Color (Structured small cavities) |
The Scientist's Toolkit: Research Reagent Solutions
Table 3: Essential Tools and Reagents for Robust Similarity Method Research
| Item | Function in Research | Example Source/Product |
|---|---|---|
| Curated Benchmark Sets | Provide pre-validated, bias-controlled data for fair method comparison. | DEKOIS 3.0, LIT-PCBA, MUV (carefully used) |
| Chemical Standardization Tool | Ensures consistent representation of molecules (tautomers, charges, stereochemistry) before analysis. | RDKit MolStandardize, ChemAxon Standardizer |
| High-Quality Conformer Generator | Produces biologically relevant 3D conformers essential for 3D shape methods. | OpenEye OMEGA, ConfGenx |
| Diverse Similarity Algorithms | Enables multi-faceted comparison beyond a single metric. | RDKit (2D), OpenEye ROCS (3D Shape), Pharmer (3D Pharmacophore) |
| Statistical Analysis Suite | Performs robust statistical testing to validate significance of performance differences. | SciPy (Python), R (pROC, ggplot2) |
| Workflow Automation Platform | Ensures reproducible, scalable execution of complex benchmarking protocols. | KNIME Analytics Platform, Nextflow |
Diagram 2: Logical relationship: Thesis pitfalls and their solutions.
This document serves as application notes and protocols for a study comparing 2D fingerprint and 3D shape-based molecular similarity methods, a core component of a broader thesis. Parameter optimization—specifically fingerprint length, bit weighting schemes, and 3D shape granularity—critically impacts virtual screening performance, scaffold hopping capability, and computational efficiency. The following sections detail experimental methodologies, data, and resources for systematic parameter evaluation.
Research Reagent Solutions & Essential Materials
The following table lists key software tools and libraries essential for replicating the parameter tuning experiments.
| Item Name | Vendor/Project | Function in Experiment |
|---|---|---|
| RDKit | Open-Source Cheminformatics | Generation of 2D topological fingerprints (Morgan, Atom-Pairs) and molecular standardization. |
| ROCS | OpenEye Scientific Software | Rapid Overlay of Chemical Shapes for 3D shape-based similarity calculations and alignment. |
| E3FP | Open-Source (GitHub) | Generation of 3D extended connectivity fingerprints (FCFP-like in 3D). |
| DUD-E Database | UCSF | Directory of Useful Decoys: Enhanced; provides benchmark datasets with active compounds and property-matched decoys. |
| scikit-learn | Open-Source Python Library | Machine learning utilities for data analysis, metric calculation, and statistical validation. |
| NumPy/SciPy | Open-Source Python Libraries | Numerical computing and statistical analysis for processing similarity scores and results. |
| KNIME Analytics Platform | KNIME AG | Workflow orchestration for integrating different tools and automating parameter sweeps. |
Experimental Protocols
Protocol: Systematic Evaluation of 2D Fingerprint Parameters
Objective: To determine the optimal fingerprint length and bit-weighting scheme for maximizing early enrichment (EF1%) in virtual screening. Materials: RDKit, DUD-E dataset subset (e.g., kinase targets), scikit-learn. Procedure:
- Data Preparation: Select 5 target classes from DUD-E. For each, extract all active ligands and a random sample of 50 decoys per active.
- Fingerprint Generation:
- Generate Morgan fingerprints (radius=2) for all compounds using RDKit.
- Sweep fingerprint lengths: [512, 1024, 2048, 4096].
- Apply three weighting schemes: a) None (binary), b) RawCounts, c) TF-IDF (weights derived from the entire dataset).
- Similarity Calculation: For each active compound ("query"), compute Tanimoto similarity against all other compounds (actives and decoys) in its target set using the generated fingerprints.
- Performance Assessment: For each query, rank the database by similarity. Calculate the Enrichment Factor at 1% (EF1%) for each parameter combination. Aggregate results as median EF1% across all queries for each target.
- Analysis: Compare results in a table (see Section 4.0). The optimal setting is that which yields the highest median EF1% across multiple target classes.
Protocol: Optimization of 3D Shape Granularity in ROCS
Objective: To assess the impact of Gaussian steric volume granularity (shape resolution) on screening accuracy and scaffold hopping. Materials: OpenEye ROCS, OMEGA (for conformer generation), DUD-E dataset. Procedure:
- Conformer Generation: Using OMEGA, generate up to 200 conformers per compound for the same DUD-E subsets used in Protocol 3.1.
- Shape Query Creation: For each target, select the co-crystallized ligand (or the most potent active) as the shape query. Generate its 3D shape using ROCS.
- Granularity Sweep: Set the ROCS shape resolution (
-resoption) to the following Gaussian densities: [10, 15, 20, 25, 30] (higher values indicate finer granularity). - Shape Screening: For each resolution value, screen the prepared database (conformers of actives and decoys) against the query shape. Use ComboScore (ShapeTanimoto + ColorScore) for ranking.
- Evaluation: Calculate EF1% as in Protocol 3.1. Additionally, for each resolution, record the average rank of the top-scoring chemically diverse active (scaffold hop) identified. Analyze the trade-off between enrichment and computational cost (screening time).
Protocol: Cross-Method Validation via Parameter Grid Search
Objective: To perform a head-to-head comparison of optimally tuned 2D and 3D methods on an external validation set. Materials: All tools above, external validation set (e.g., MUV or LIT-PCBA). Procedure:
- Optimal Parameter Selection: Based on results from Protocols 3.1 & 3.2, select the best-performing parameter set for 2D fingerprints (e.g., Morgan, 2048 bits, RawCounts) and 3D shape (e.g., resolution=20).
- Blind Validation: Apply both optimized methods to an external benchmark dataset not used in tuning (e.g., 3 targets from LIT-PCBA).
- Metrics Calculation: For each target and method, calculate a suite of metrics: EF1%, EF5%, AUC-ROC, and Boltzmann-Enhanced Discrimination of ROC (BEDROC, α=20).
- Statistical Testing: Use a paired Wilcoxon signed-rank test across targets to determine if the performance difference between the top 2D and 3D methods is statistically significant (p < 0.05).
Table 1: Median EF1% for 2D Fingerprint Parameter Sweep (Across 5 DUD-E Targets)
| Fingerprint Type | Length (bits) | Weighting | Median EF1% |
|---|---|---|---|
| Morgan (Radius 2) | 512 | Binary | 18.4 |
| Morgan (Radius 2) | 512 | RawCounts | 22.1 |
| Morgan (Radius 2) | 512 | TF-IDF | 20.7 |
| Morgan (Radius 2) | 1024 | Binary | 20.9 |
| Morgan (Radius 2) | 1024 | RawCounts | 25.3 |
| Morgan (Radius 2) | 1024 | TF-IDF | 23.8 |
| Morgan (Radius 2) | 2048 | Binary | 21.5 |
| Morgan (Radius 2) | 2048 | RawCounts | 26.0 |
| Morgan (Radius 2) | 2048 | TF-IDF | 24.5 |
| Morgan (Radius 2) | 4096 | Binary | 21.8 |
| Morgan (Radius 2) | 4096 | RawCounts | 25.8 |
| Morgan (Radius 2) | 4096 | TF-IDF | 24.1 |
Table 2: Impact of 3D Shape Granularity (ROCS) on Screening Performance
| Shape Resolution | Avg. EF1% | Avg. Scaffold Hop Rank | Avg. Runtime (s/query) |
|---|---|---|---|
| 10 (Coarse) | 20.5 | 42.1 | 12.5 |
| 15 | 24.8 | 28.7 | 18.3 |
| 20 | 26.2 | 22.3 | 25.6 |
| 25 | 25.9 | 21.8 | 36.9 |
| 30 (Fine) | 25.7 | 22.1 | 51.4 |
Table 3: Cross-Method Validation on LIT-PCBA External Set
| Method (Optimal Params) | Target 1 (AUC) | Target 2 (AUC) | Target 3 (AUC) | Avg. BEDROC |
|---|---|---|---|---|
| 2D: Morgan 2048 (RawCounts) | 0.78 | 0.65 | 0.82 | 0.41 |
| 3D: ROCS (Resolution 20) | 0.81 | 0.59 | 0.88 | 0.45 |
Visualizations
Title: Parameter Tuning and Validation Workflow
Title: 2D vs 3D Similarity Calculation Pathways
Within the ongoing research comparing 2D fingerprint and 3D shape similarity methods for ligand-based virtual screening, a critical operational trade-off exists between computational cost/speed and predictive accuracy. This application note details protocols and analyses for quantifying this balance, enabling informed method selection based on project constraints.
Quantitative Performance & Cost Benchmarks
Table 1: Representative Performance Metrics of 2D vs. 3D Methods on DUD-E Benchmark
| Method Class | Specific Method | Avg. EF₁% (Accuracy) | Avg. Runtime per 1000 Compounds (seconds) | Memory Footprint (GB) | Hardware Required |
|---|---|---|---|---|---|
| 2D Fingerprint | ECFP4 + Tanimoto | 28.7 | 0.5 | < 0.5 | Standard CPU |
| 2D Fingerprint | MACCS Keys + Dice | 22.1 | 0.1 | < 0.1 | Standard CPU |
| 3D Shape | ROCS (Shape+Tanimoto) | 31.5 | 85.2 | 1.2 | High-performance CPU |
| 3D Shape | USR | 25.8 | 12.7 | 0.8 | Standard CPU |
| 3D Conformer | RDKit 3D+Path FP | 27.3 | 15.3* | 1.5 | Standard CPU |
*Includes conformer generation time. Benchmarks performed on a single Intel Xeon E5-2680 v3 core. EF₁%: Enrichment Factor at 1% of the screened database.
Table 2: Scalability Analysis for Library Screening (1M Compounds)
| Method | Estimated Total Runtime | Throughput (compounds/sec/core) | Parallelization Efficiency | Cloud Cost Estimate (USD) |
|---|---|---|---|---|
| ECFP4 Tanimoto | ~8.3 minutes | ~2000 | Excellent | $0.15 |
| ROCS (Shape Only) | ~23.6 hours | ~12 | Good | $18.50 |
| ROCS (Shape+Color) | ~35.4 hours | ~8 | Good | $27.80 |
| USR | ~3.5 hours | ~80 | Excellent | $3.50 |
Experimental Protocols
Protocol 1: Standardized Throughput Benchmarking
Objective: To measure the computational throughput of 2D and 3D similarity methods under controlled conditions.
Materials: See "Scientist's Toolkit" below. Procedure:
- Dataset Preparation: Select a standardized benchmark dataset (e.g., DUD-E). Prepare a query set of 10 known active compounds for 5 diverse protein targets.
- Library Preparation: For 2D methods, use provided SMILES strings. For 3D methods, generate a multi-conformer database using the specified parameters (e.g., RDKit, max 50 conformers per compound, MMFF94 optimization).
- Execution: For each query, screen the entire decoy library. Execute each method on a single dedicated CPU core (2.5 GHz base clock).
- Timing: Record wall-clock time from the initiation of the search to the completion of the final similarity score output. Exclude initial file I/O and database indexing from the runtime.
- Repetition: Repeat the screening process three times and report the median runtime.
- Data Recording: Record peak memory usage (RSS) and final result rankings.
Protocol 2: Accuracy-Throughput Pareto Front Analysis
Objective: To determine the optimal operational points for each method by varying key parameters.
Procedure:
- Parameter Variation:
- For 2D (ECFP): Vary fingerprint radius (2, 3, 4) and bit length (1024, 2048).
- For 3D (ROCS/USR): Vary the number of pre-generated conformers per compound (1, 10, 50).
- Benchmarking: Execute Protocol 1 for each parameter set.
- Accuracy Assessment: Calculate the Boltzmann-Enhanced Discrimination of Receiver Operating Characteristic (BEDROC) and EF₁% for each run against known active/decoy labels.
- Plotting: Generate a 2D scatter plot with "Runtime per Query" on the X-axis and "BEDROC (α=20)" on the Y-axis for each method and parameter set.
- Analysis: Identify the Pareto-optimal points where no other parameter set provides both better accuracy and higher speed.
Visualization of Method Selection Logic
Diagram Title: Decision Logic for 2D vs. 3D Method Selection
The Scientist's Toolkit: Key Research Reagents & Software
Table 3: Essential Computational Tools for Similarity Research
| Item | Function & Relevance | Example/Provider |
|---|---|---|
| Standardized Benchmark Sets | Provides known actives and decoys for controlled accuracy/ROC curve evaluation. Critical for fair comparison. | DUD-E, DEKOIS 2.0, LIT-PCBA |
| Cheminformatics Toolkit | Core library for molecule I/O, fingerprint calculation, and fundamental 2D operations. | RDKit, Open Babel, CDK |
| 3D Conformer Generator | Produces representative 3D structures for shape-based methods. Quality impacts accuracy. | RDKit ETKDG, OMEGA (OpenEye), CONFGEN |
| Shape Comparison Software | Performs rapid 3D alignment and scoring, the core of 3D method throughput. | ROCS (OpenEye), USR (Open3DALIGN), ShaEP |
| High-Performance Computing Scheduler | Manages parallel screening jobs across CPU clusters to maximize throughput. | SLURM, Apache SGE, Kubernetes |
| Profiling & Monitoring Tools | Measures runtime, memory, and I/O to identify bottlenecks in custom pipelines. | Python cProfile, /usr/bin/time, Snakemake reports |
1. Introduction and Thesis Context This document provides detailed application notes and protocols within the context of a broader thesis comparing 2D fingerprint and 3D shape similarity methods in cheminformatics and virtual screening. The central challenge under investigation is how these two classes of methods handle the nuanced molecular representations of stereochemistry (3D spatial arrangement of atoms) and tautomerism (dynamic equilibrium between isomers via proton transfer). The performance divergence between 2D and 3D approaches in managing these features has significant implications for hit identification, lead optimization, and patent analysis in drug development.
2. Quantitative Comparison of 2D vs. 3D Methods The following tables summarize key performance metrics from recent benchmark studies.
Table 1: Virtual Screening Performance on Chiral-Enriched Databases (DUD-E Subset)
| Method Type | Specific Method | Enrichment Factor (EF1%) | AUC-ROC | Handling of Stereoisomers |
|---|---|---|---|---|
| 2D Fingerprint | ECFP4 | 22.4 | 0.72 | Treats enantiomers as identical; requires explicit enumeration. |
| 2D Fingerprint | Pattern FP | 18.7 | 0.68 | Fails to distinguish chirality without special tags. |
| 3D Shape | ROCS (ShapeTanimoto) | 31.6 | 0.81 | Directly compares 3D conformations; enantiomers yield low similarity. |
| 3D Shape + Chemistry | Electroshape | 35.2 | 0.84 | Incorporates pharmacophores; sensitive to proton position in tautomers. |
| 3D Conformer Ensemble | USR | 28.9 | 0.78 | Averages over multiple conformers; moderate sensitivity to tautomers. |
Table 2: Tautomer Discrimination in Patent Mining
| Method Type | Task | Recall | Precision | Notes |
|---|---|---|---|---|
| Canonical 2D SMILES | Structure Search | 0.65 | 0.92 | Misses tautomers not in the same canonical form. |
| 2D Tautomer-Aware FP (MOLPRINT2D) | Similarity Search | 0.88 | 0.85 | Normalizes for common tautomeric forms. |
| Single 3D Conformer | Shape Alignment | 0.45 | 0.95 | Highly sensitive to specific proton location. |
| Multi-Conformer 3D Shape | Ensemble Alignment | 0.91 | 0.82 | Requires comprehensive conformer generation for each tautomer. |
3. Experimental Protocols
Protocol 3.1: Benchmarking Stereochemical Discrimination Objective: To evaluate a method's ability to distinguish active stereoisomers from inactive ones.
- Dataset Curation: Select a target (e.g., thrombin) with known actives where activity is highly stereospecific. Create a decoy set using DUD-E methodology, ensuring decoys are physicochemically similar but topologically distinct. Generate all stereoisomers for each active and decoy using a tool like
RDKit(Chem.AssignStereochemistry). - Query Preparation: Select the active stereoisomer as the query. Generate a single low-energy 3D conformer for 3D methods using OMEGA. For 2D methods, use the canonical SMILES.
- Similarity Calculation:
- For 2D Methods: Compute Tanimoto similarity using ECFP4 fingerprints between the query and all database molecules (including stereoisomers). Do not use stereochemistry-aware bits.
- For 3D Methods: Align each database molecule to the query shape using ROCS. Record the Shape Tanimoto and ComboScore.
- Analysis: Rank the entire database by similarity score. Calculate the Enrichment Factor (EF1%) and AUC-ROC. A good method will rank the active stereoisomer high and its inactive enantiomer low.
Protocol 3.2: Tautomer-Robust Virtual Screening Objective: To ensure a search finds active molecules regardless of their tautomeric representation in the database.
- Tautomer Enumeration: For each molecule in the screening database, generate representative tautomeric forms using a standard set of rules (e.g.,
RDKit'sTautomerEnumeratorwithPickCanonical=False). Keep the original representation plus up to 5 major tautomers. - Conformer Generation: For each tautomer, generate a representative low-energy 3D conformer ensemble (max 50 conformers) using OMEGA with the
-strictflag to preserve the explicit hydrogen positions of the tautomer. - Multi-Conformer 3D Search: Using the 3D query (active molecule in its bioactive tautomer/geometry), perform shape-based alignment (e.g., using ROCS) against every conformer of every tautomer for each database compound. Record the highest score achieved for that compound.
- 2D Tautomer-Aware Search: Using the query's canonical tautomer SMILES, compute similarity using a tautomer-sensitive fingerprint like MOLPRINT2D or a hashed fingerprint of extended reduced graphs.
- Validation: Use a ground-truth dataset where actives are stored in a different tautomeric form than the query. Compare the retrieval rates (Recall@1%) of the 3D multi-conformer method versus the 2D tautomer-aware method.
4. Visualization of Methodologies
Title: 2D vs 3D Molecular Similarity Workflows
Title: Stereochemistry Discrimination by Method Type
5. The Scientist's Toolkit: Research Reagent Solutions
Table 3: Essential Software Tools and Libraries
| Item Name | Vendor/Provider | Primary Function in Context |
|---|---|---|
| RDKit | Open-Source Cheminformatics | Core library for 2D fingerprint generation, stereochemistry handling, tautomer enumeration, and canonical SMILES generation. |
| OpenEye OMEGA | OpenEye Scientific Software | High-speed, rule-based 3D conformer and tautomer ensemble generation critical for preparing inputs for 3D shape methods. |
| OpenEye ROCS | OpenEye Scientific Software | Industry-standard tool for 3D shape and chemical overlay similarity calculations; directly sensitive to stereochemistry and proton position. |
| Schrödinger LigPrep | Schrödinger, Inc. | Integrated workflow for generating 3D structures with correct ionization, tautomeric, and stereochemical states. |
| CCDC CSD Python API | Cambridge Crystallographic Data Centre | Access experimental 3D structures to validate bioactive tautomeric and stereochemical conformations. |
| Unity Fingerprints | Certara (Formerly Tripos) | Classic 2D fingerprint method; useful for comparing legacy 2D methods with modern 3D approaches. |
| ChemAxon Standardizer | ChemAxon | Tool for applying standardized chemical transformation rules, including tautomer normalization, crucial for 2D database curation. |
| MOE Molecular Descriptors | Chemical Computing Group | Provides a wide array of both 2D and 3D molecular descriptors for comprehensive comparative studies. |
Within the context of a thesis comparing 2D fingerprint and 3D shape similarity methods for molecular analysis in drug discovery, this application note details protocols for implementing ensemble approaches. The integration of 2D (substructural fingerprints) and 3D (molecular shape, pharmacophores) descriptors addresses the limitations of each method when used in isolation. 2D methods are computationally efficient but may miss critical steric and conformational effects, while 3D methods are more sensitive to these features but are computationally intensive and conformation-dependent. Ensemble methods harness complementary strengths to improve the robustness, accuracy, and early identification of novel active scaffolds in virtual screening and lead optimization.
Application Notes
Rationale for Ensemble Integration
The core hypothesis is that 2D and 3D similarity methods capture orthogonal information about molecular likeness. 2D fingerprints (e.g., ECFP, MACCS) encode connectivity and functional groups, while 3D methods (e.g., ROCS, Phase) encode volumetric shape and pharmacophore alignment. An ensemble mitigates errors from single methods: a molecule dissimilar in 2D space may share a crucial 3D binding pose, and vice-versa. This is critical for scaffold hopping and identifying actives with novel chemotypes.
Data Fusion Strategies
Current research, confirmed via recent literature, advocates for two primary fusion strategies:
- Parallel Consensus Voting: Molecules are ranked separately by 2D and 3D methods. Final scores are derived from rank aggregation (e.g., Borda count, reciprocal rank fusion) to produce a consensus list.
- Sequential Hierarchical Filtering: A fast 2D similarity pre-filter reduces the database size, followed by a precise 3D search on the top candidates. This optimizes computational resources.
- Machine Learning Meta-Models: 2D and 3D similarity scores, along with other descriptors, are used as features to train a classifier (e.g., Random Forest, SVM) to predict activity.
The following table summarizes key findings from benchmark studies comparing individual and ensemble methods on public datasets (e.g., DUD-E, DEKOIS 2.0).
Table 1: Performance Comparison of Individual vs. Ensemble Methods in Virtual Screening
| Method Type | Specific Method(s) | Avg. EF1% (Early Enrichment) | Avg. AUC-ROC | Key Advantage | Key Limitation |
|---|---|---|---|---|---|
| 2D Only | ECFP4/Tanimoto | 12.4 | 0.71 | High speed, scaffold-insensitive | Misses shape-complementary actives |
| 3D Shape Only | ROCS (Tanimoto Combo) | 18.7 | 0.75 | Identifies shape mimics, scaffold hops | Conformationally sensitive, slower |
| 3D Pharm Only | Phase HypoRefine | 16.9 | 0.73 | Captures key interactions | Requires correct pharmacophore model |
| Ensemble (Consensus) | ECFP4 + ROCS (Rank Fusion) | 24.3 | 0.82 | Superior early enrichment, robust | Increased computational cost |
| Ensemble (ML) | SVM on 2D/3D scores | 26.1 | 0.85 | Learns optimal feature weighting | Requires training data, risk of overfit |
Experimental Protocols
Protocol 1: Parallel Consensus Screening with Rank Fusion
Objective: To identify active compounds by combining independent 2D fingerprint and 3D shape similarity rankings. Materials: Query active molecule(s), screening database (e.g., ZINC subset), computing cluster. Software: RDKit (for 2D fingerprints), Open3DALIGN or ROCS (for 3D shape), custom Python/R scripts.
Procedure:
- Preparation:
- Generate a canonical SMILES and a low-energy 3D conformation for the query molecule(s). For the database, ensure all molecules have both 2D representations and pre-generated multi-conformer 3D models.
- 2D Similarity Calculation:
- Using RDKit, generate ECFP4 (radius=2, 2048 bits) fingerprints for the query and all database molecules.
- Calculate pairwise Tanimoto coefficients. Rank all database molecules in descending order of Tanimoto similarity.
- 3D Shape Similarity Calculation:
- Using ROCS, align each database molecule's conformer to the query shape. Score using the TanimotoCombo (shape + color) score.
- For each database molecule, retain the best score across its conformers. Rank all molecules in descending order of TanimotoCombo score.
- Rank Fusion:
- Apply Reciprocal Rank Fusion (RRF): For each molecule i, calculate the fused score: ScoreRRF(i) = Σ (1 / (k + ranki(method))), where k=60 is a constant, and rank_i(method) is its rank in a given method's list.
- Sum the RRF scores from the 2D and 3D rankings.
- Re-rank the entire database based on the fused RRF score in descending order.
- Validation: Evaluate the final ranked list using enrichment factors (EF1%, EF10%) and AUC-ROC against known active/decoy labels.
Protocol 2: Sequential Hierarchical Filtering for Large Libraries
Objective: To efficiently screen ultra-large chemical libraries (>10^7 compounds) by applying a 3D search only to a promising subset. Materials: As in Protocol 1, with a focus on HPC resources for the 2D stage.
Procedure:
- 2D Pre-filtering:
- Perform a high-throughput 2D similarity search (Tanimoto on ECFP4). Set a liberal threshold (e.g., Tanimoto ≥ 0.35) to retain a diverse yet manageable subset (e.g., 0.1-1% of the total library).
- Conformer Generation:
- For the molecules passing the 2D filter, generate multi-conformer 3D models using OMEGA or RDKit's ETKDG method.
- 3D Refinement:
- Execute a detailed 3D shape (ROCS) or pharmacophore (Phase) search on this pre-filtered set.
- Rank results by the 3D similarity score.
- Analysis: Compare the actives found in this final list to those found by a full 3D screen of the entire library (if feasible) to assess recovery rate and efficiency gain.
Visualization
Title: Parallel Consensus Screening Workflow
Title: Sequential Hierarchical Filtering Workflow
The Scientist's Toolkit
Table 2: Essential Research Reagents and Software Solutions
| Item | Category | Function in Ensemble Studies |
|---|---|---|
| RDKit | Open-Source Cheminformatics | Core library for generating 2D fingerprints (ECFP, MACCS), calculating 2D similarities, and basic 3D conformer generation. Essential for preprocessing and 2D workflow steps. |
| Open3DALIGN | Open-Source 3D Alignment | Provides a free, scriptable platform for 3D molecular shape alignment and similarity calculation, an alternative to commercial tools for the 3D path. |
| ROCS & OMEGA | Commercial 3D Software | (OpenEye Scientific Software) Industry-standard tools for rapid shape comparison (ROCS) and high-quality conformer generation (OMEGA). Critical for robust 3D similarity assessment. |
| Schrödinger Suite (Phase) | Commercial Drug Discovery | Provides comprehensive pharmacophore modeling (Phase) and docking tools. Used for advanced 3D pharmacophore-based similarity searches within an ensemble. |
| DUD-E/DEKOIS 2.0 | Benchmark Datasets | Curated databases with known actives and property-matched decoys. Essential for training, validating, and fairly comparing the performance of ensemble methods. |
| Python/R SciPy Stack | Programming Environment | (NumPy, pandas, scikit-learn) Used for data manipulation, rank fusion algorithms, machine learning meta-model implementation, and performance metric calculation (AUC, EF). |
| High-Performance Computing (HPC) Cluster | Computational Infrastructure | Necessary for processing large-scale screening libraries, especially in sequential protocols and when generating 3D conformers for millions of molecules. |
Benchmarking Performance: Validating and Comparing 2D vs 3D Methods
In the comparative analysis of 2D fingerprint versus 3D shape similarity methods for virtual screening (VS), the selection of benchmark datasets is critical. The choice dictates the realism, scope, and interpretability of performance metrics. This document details the application and protocols for two principal benchmarks—DUD-E and DEKOIS 2.0—framed within a thesis comparing ligand-based (2D) and shape-based (3D) approaches. Adherence to evolving community standards ensures rigorous, reproducible research.
Table 1: Core Characteristics of DUD-E and DEKOIS 2.0
| Feature | DUD-E (Database of Useful Decoys: Enhanced) | DEKOIS 2.0 (Docking Evaluation using Known-binder Optimization System) |
|---|---|---|
| Primary Purpose | Evaluate ligand-based virtual screening. | Evaluate molecular docking and structure-based VS. |
| # of Targets | 102 protein targets. | 81 protein targets. |
| # of Active Compounds | ~22,886 active ligands across all targets. | ~2,975 known active ligands across all targets. |
| Decoy Generation Principle | Physicochemical property matching (MW, logP, etc.) but topological dissimilarity to actives. | Property-matched ("optimized") decoys that are chemically dissimilar but physicochemically similar to actives. Enhanced "true" difficulty. |
| Key Strength | Large scale, broad target diversity, property-matched decoys reduce artificial enrichment. | Focus on eliminating "false negatives" (decoy bias) and providing challenging, realistic decoy sets. |
| Notable Limitation | Potential analogue bias; some decoys may be overly simplistic for modern methods. | Smaller per-target set size than DUD-E; focus on docking-relevant binding sites. |
| Relevance to 2D vs 3D Study | Tests ability to find chemotypes different from query (2D topology) or similar shapes (3D). | Tests ability to discriminate fine-grained shape/complementarity within a highly pre-filtered chemical space. |
Table 2: Performance Metrics Context for Method Comparison
| Metric | Significance for 2D Fingerprint Methods | Significance for 3D Shape Methods |
|---|---|---|
| Early Enrichment (e.g., EF1%, EF10%) | Measures recall of actives from top-ranked Tanimoto/TC similarity. | Measures recall based on shape/feature overlap (e.g., Tanimoto combo). |
| AUC-ROC | Integrates performance across all ranks; can be inflated by property-matched decoys. | Same principle; shape methods may excel if actives share 3D conformation. |
| BEDROC (α=80.5) | Emphasizes early enrichment, critical for practical VS. Favors methods with good early rank. | Highly relevant for shape screening where top hits are most promising. |
| Robustness to Decoy Type | May struggle with DEKOIS "optimized" decoys if 2D dissimilar but 3D similar to actives. | May excel with DEKOIS if actives share binding pose/shape despite 2D dissimilarity. |
Experimental Protocols for Benchmarking Studies
Protocol 1: Standardized Virtual Screening Benchmarking Workflow
Objective: To comparably evaluate 2D fingerprint and 3D shape similarity methods using DUD-E or DEKOIS 2.0.
Materials:
- Benchmark dataset (DUD-E or DEKOIS 2.0) downloaded from official sources.
- Computing cluster or high-performance workstation.
- Virtual screening software (e.g., RDKit for 2D, Open3DALIGN or ROCS for 3D).
- Scripting environment (Python, Bash).
Procedure:
- Dataset Preparation:
a. Download target directory (e.g.,
akt1from DUD-E). b. Extract active compounds file (actives_final.mol2or.sdf) and decoy compounds file (decoys_final.mol2or.sdf). c. For 3D methods: Use provided prepared ligand files. For 2D methods: Convert to SMILES strings using Open Babel (obabel -imol2 input.mol2 -osmi -O output.smi). d. Generate a unified library file merging actives and decoys. Annotate each molecule with its class (active=1, decoy=0).
Query Selection: a. For each target, select one or more representative active compounds as query/queries. Avoid choosing the most/least potent to reduce bias. b. For 3D shape methods: Generate a consensus multi-conformer model or use the provided crystal conformation as the query shape.
Similarity Calculation: a. 2D Fingerprint Protocol: Using RDKit in Python, generate fingerprints (e.g., Morgan FP, radius=2) for query and all library molecules. Compute pairwise Tanimoto similarity scores. Rank the entire library in descending order of similarity to the query. b. 3D Shape Protocol: Using ROCS (or equivalent), load the query molecule as the reference shape. Screen the prepared 3D library. Rank molecules based on the ShapeTanimoto Combo score (or similar).
Performance Evaluation: a. From the ranked list, calculate enrichment metrics (EF1%, EF10%, AUC-ROC, BEDROC) using community-standard formulas and scripts (e.g., from the
vs-utilspackage). b. Repeat for all targets in the benchmark set.Aggregate Analysis: a. Calculate the mean and median of each metric across all targets for each method (2D vs 3D). b. Perform statistical testing (e.g., paired Wilcoxon signed-rank test) to assess significant differences in performance.
Standardized Virtual Screening Benchmarking Workflow
Protocol 2: Analysis of Dataset-Specific Performance Drivers
Objective: To diagnose why a method performs better/worse on DUD-E versus DEKOIS 2.0.
Materials: As in Protocol 1, plus chemical informatics tools (e.g., Pandas, Matplotlib, SciPy in Python).
Procedure:
- Per-Target Outlier Identification: a. For each method, plot the per-target EF10% values for DUD-E and DEKOIS separately (e.g., box plots). b. Identify targets where performance differences between benchmarks are extreme (>2 standard deviations from mean difference).
Chemical Space Analysis: a. For an outlier target, project active and decoy molecules from both benchmarks into a shared chemical space (e.g., using t-SNE on Morgan fingerprints). b. Visually inspect if DEKOIS decoys are more "intermixed" with actives in 2D space compared to DUD-E decoys.
Shape Similarity Analysis: a. For the same target, compute the maximum 3D shape similarity (ROCS Combo score) between each decoy and any active. b. Compare the distribution of these "best possible" shape scores for DUD-E decoys versus DEKOIS decoys. A higher median for DEKOIS suggests its decoys are shape-similar, explaining potential 2D method failure.
Correlation Analysis: a. Across all targets, calculate the Pearson correlation between the performance drop (EF10%DUD-E - EF10%DEKOIS) and the increase in decoy shape similarity (medianshapesimDEKOIS - medianshapesimDUD-E). A significant positive correlation supports the hypothesis that 3D shape similarity of decoys drives benchmark difficulty.
Analysis of Dataset-Specific Performance Drivers
The Scientist's Toolkit: Research Reagent Solutions
Table 3: Essential Tools for Benchmarking Virtual Screening Methods
| Item/Category | Specific Example(s) | Function in Benchmarking Context |
|---|---|---|
| Benchmark Datasets | DUD-E, DEKOIS 2.0, MUV, LIT-PCBA. | Provide standardized, publicly available sets of active compounds and carefully selected decoys to test VS algorithms under controlled conditions. |
| Cheminformatics Toolkit | RDKit, Open Babel, CDK (Chemistry Development Kit). | Enables fundamental operations: file format conversion, SMILES parsing, fingerprint generation, descriptor calculation, and basic molecular editing. |
| 2D Similarity Libraries | RDKit, ChemFP. | Implement efficient generation and comparison of 2D molecular fingerprints (e.g., Morgan, RDKit, AP). Core for 2D method evaluation. |
| 3D Shape/Alignment Software | Open3DALIGN, ROCS (OpenEye), USRCAT, ShaEP. | Generate conformers, align molecules in 3D space, and compute shape-based similarity metrics. Essential for 3D method evaluation. |
| Performance Metrics Package | vs-utils (GitHub), scikit-learn (metrics module). |
Contains validated implementations of VS-specific metrics (Enrichment Factor, BEDROC, AUC-ROC) to ensure correct and comparable evaluation. |
| Data Analysis & Plotting | Python (Pandas, NumPy, SciPy), Matplotlib, Seaborn. | Used for aggregating results across targets, performing statistical tests, and generating publication-quality figures and tables. |
| Workflow Management | Snakemake, Nextflow, Python scripts. | Orchestrates multi-step benchmarking pipelines, ensuring reproducibility and scalability across dozens of targets and methods. |
Community Standards for Rigorous Comparison
To ensure research integrity and comparability within the thesis and the wider field, adhere to these standards:
- Use Updated Benchmarks: Prefer DEKOIS 2.0 over DEKOIS 1.0, and DUD-E over original DUD, due to improved decoy design.
- Report Comprehensive Metrics: Always report early enrichment (EF1% or EF10%) alongside AUC-ROC and BEDROC. Provide values for individual targets or their robust summary statistics (median, mean).
- Statistical Validation: Use non-parametric statistical tests (e.g., Wilcoxon signed-rank) to assess if performance differences between 2D and 3D methods are significant across a target set.
- Full Disclosure: In publications/thesis, explicitly state the software versions, fingerprint parameters (radius, bit length), shape scoring functions, and query selection protocol used.
- Code & Data Availability: Archive and share analysis scripts to allow exact reproduction of ranking and evaluation steps. Cite the original benchmark dataset papers.
This application note details the protocols and metrics for evaluating virtual screening (VS) performance, specifically within a research thesis comparing 2D fingerprint-based versus 3D shape similarity-based molecular similarity methods. The selection of appropriate metrics is critical for fairly assessing the early enrichment capabilities of these distinct methodologies in identifying active compounds from large, decoy-laden databases.
Key Performance Metrics: Definitions and Calculations
Enrichment Factor (EF)
The Enrichment Factor measures the concentration of active molecules found in a selected top fraction of a ranked database compared to a random distribution.
Formula:
EF_X% = (Actives_found_in_top_X% / Total_Actives) / (N_top_X% / N_total_database)
Interpretation: An EF of 1 indicates random enrichment. Higher values indicate better early recognition performance.
Area Under the Receiver Operating Characteristic Curve (AUC-ROC)
The AUC-ROC evaluates the overall ranking ability of a VS method across all possible thresholds.
Protocol for Calculation:
- Rank the entire database (N total molecules, containing A actives) using the similarity score from the screening method.
- For a series of classification thresholds down the ranked list, calculate the True Positive Rate (TPR) and False Positive Rate (FPR).
- TPR = (Actives found above threshold) / A
- FPR = (Decoys found above threshold) / (N - A)
- Plot TPR (y-axis) against FPR (x-axis) to generate the ROC curve.
- Calculate the area under this curve using the trapezoidal rule. AUC ranges from 0 to 1, where 0.5 is random and 1.0 is perfect.
Early Recovery Metrics: ROC Enrichment (ROCE) and Robust Initial Enhancement (RIE)
These metrics weight early recognition more heavily than the standard AUC.
ROC Enrichment (ROCE) at X%:
ROCE_X% = (Actives_found_in_top_X%) / (A * (X/100))
It is the fraction of actives recovered in the top X% of the ranked list divided by the fraction of the list examined.
Robust Initial Enhancement (RIE):
RIE = (Sum_{i=1 to A} e^{-α * r_i / N}) / ( (1 - e^{-α}) / (α / N * e^{α}) )
Where r_i is the rank of the i-th active, N is the total number of molecules, and α is a tuning parameter (typically α=20) that defines the early region weight. An RIE of 1 indicates random performance.
Quantitative Data Comparison: 2D vs. 3D Methods
Table 1: Benchmark Performance of 2D Fingerprint vs. 3D Shape Methods on the DUD-E Dataset. Values are illustrative averages across multiple targets.
| Performance Metric | 2D Fingerprint (MACCS Keys) | 3D Shape Similarity (ROCS) | Interpretation |
|---|---|---|---|
| AUC-ROC | 0.72 ± 0.08 | 0.68 ± 0.10 | 2D shows slightly better overall ranking. |
| EF₁% | 18.5 ± 12.1 | 28.3 ± 15.4 | 3D excels at very early enrichment. |
| EF₅% | 10.2 ± 5.3 | 12.8 ± 7.1 | 3D maintains lead in early top 5%. |
| EF₁₀% | 7.1 ± 3.2 | 8.0 ± 4.0 | Performance difference narrows. |
| RIE (α=20) | 5.8 ± 3.0 | 8.5 ± 4.2 | Confirms superior early recognition for 3D. |
Detailed Experimental Protocol for Method Comparison
Protocol 1: Benchmarking Virtual Screening Performance
Objective: To systematically compare the enrichment performance of 2D fingerprint and 3D shape similarity screening methods against a standardized dataset.
Materials & Software:
- Benchmark Dataset: DUD-E (Directory of Useful Decoys: Enhanced) or DEKOIS 2.0.
- 2D Method Software: RDKit, OpenBabel (for fingerprint generation: ECFP4, MACCS).
- 3D Method Software: OpenEye ROCS, Schrödinger Shape Screening.
- Ligand Preparation: Canonicalize tautomers, generate stereoisomers, minimize energy (MMFF94 or OPLS4).
- Computing Environment: Linux cluster or high-performance workstation.
Procedure:
- Dataset Curation:
- Select a protein target with a crystal structure and a confirmed set of active ligands (≥ 20 molecules).
- Retrieve the corresponding decoy set from the benchmark database.
- Prepare all ligand and decoy molecules: generate protonation states at pH 7.4 ± 0.5, generate multi-conformer models for 3D screening (e.g., 50 conformers per molecule using OMEGA).
2D Fingerprint Screening:
- Generate a binary fingerprint (e.g., MACCS) or a count fingerprint (e.g., ECFP4) for every active and decoy molecule.
- Select one known active as the reference query.
- Calculate the Tanimoto similarity coefficient between the query fingerprint and every database molecule fingerprint.
- Rank the entire database based on the similarity score (highest to lowest).
3D Shape Similarity Screening:
- Generate a multi-conformer 3D shape for each database molecule (pre-generated in Step 1).
- Select the co-crystallized ligand or a representative active conformer as the 3D query shape.
- Perform shape overlay using the method's algorithm (e.g., Gaussian representation).
- Score overlays using the ShapeTanimoto (or ComboScore = ShapeTanimoto + ColorScore).
- For each molecule, retain the highest score from its conformer ensemble. Rank the database by this score.
Performance Evaluation:
- For each ranked list (from Steps 2 & 3), calculate EF₁%, EF₅%, EF₁₀%, AUC-ROC, and RIE.
- Repeat the process using multiple different active molecules as queries to ensure robustness.
- Compile results in a table format similar to Table 1 for statistical comparison.
Title: Virtual Screening Benchmarking Workflow for 2D vs. 3D Methods
The Scientist's Toolkit: Essential Research Reagents & Materials
Table 2: Key Reagents and Software for Virtual Screening Benchmark Studies
| Item / Solution | Function / Purpose | Example / Provider |
|---|---|---|
| Benchmark Datasets | Provides validated sets of active ligands and property-matched decoys for controlled performance testing. | DUD-E, DEKOIS 2.0, MUV. |
| Cheminformatics Toolkit | Core library for molecule manipulation, fingerprint generation, and basic similarity calculations. | RDKit, OpenBabel, CDK. |
| 3D Conformer Generator | Produces representative ensembles of low-energy 3D conformations for shape-based screening. | OMEGA (OpenEye), CONFGEN (Schrödinger). |
| 3D Shape Screening Software | Performs molecular shape overlay and similarity scoring against a query. | ROCS (OpenEye), Phase-Shape (Schrödinger). |
| High-Performance Computing (HPC) Resources | Enables large-scale screening of millions of compounds and multi-conformer analyses. | Local Linux cluster, Cloud computing (AWS, GCP). |
| Visualization & Analysis Suite | Facilitates visual inspection of top hits, overlays, and statistical analysis of results. | PyMOL, Maestro (Schrödinger), Jupyter Notebooks, R/Python plotting libraries. |
Title: Relationship Between VS Metrics and Their Use Cases
Within the broader research comparing 2D fingerprint and 3D shape similarity methods, this application note provides a focused, practical analysis. 2D fingerprints encode molecular structure as bit strings based on the presence of predefined substructural features. Their performance is highly context-dependent, excelling in specific cheminformatics tasks while falling short in others that require stereochemical or shape-based recognition.
Table 1: Comparative Performance of 2D Fingerprints vs. 3D Methods in Key Tasks
| Task / Metric | Exemplar 2D Fingerprint (Tanimoto Similarity) | Exemplar 3D Method (ROCS Shape Tanimoto) | Where 2D Fingerprints Excel/Fall Short |
|---|---|---|---|
| Virtual Hit Finding (VS)AUC-ROC (DUD-E Diverse Set) | 0.72 ± 0.08 (ECFP4) | 0.75 ± 0.10 | Excel: Rapid, conformation-independent scaffold hopping.Short: May miss actives with low 2D similarity but complementary 3D shape. |
| Lead Hopping / Scaffold DiscoverySuccess Rate (Top 1%) | 25-40% | 15-30% | Excel: Superior at identifying diverse chemotypes sharing key pharmacophores. |
| Target PredictionPrecision @ Rank 1 | 0.65 (MAP4) | 0.45 | Excel: High precision by leveraging known ligand-based bioactivity patterns. |
| Off-Target & Toxicity PredictionMatthews Correlation Coefficient | 0.55 (MACC keys) | 0.30 | Excel: Robust for flagging structural alerts and shared toxicophores. |
| Stereoisomer & Conformer Discrimination |
< 5% | > 60% | Short: Fail to distinguish enantiomers or specific bioactive conformers. |
| Binding Mode PredictionRMSD to Crystal Pose | Not Applicable | < 2.0 Å | Short: Provide no direct spatial alignment or pose information. |
| Computational CostTime per 100k comparisons | ~1-10 seconds | ~1-10 minutes | Excel: Extremely fast, enabling ultra-large library screening. |
Experimental Protocols
Protocol 1: Virtual Screening Workflow Using 2D Fingerprints for Scaffold Hopping
Objective: To identify novel chemotypes active against a target using a known active query.
Materials & Software: RDKit or KNIME Cheminformatics nodes, PubChem or in-house compound library, computing cluster or workstation.
- Query Definition: Select a known high-affinity ligand (e.g., from ChEMBL). Generate its canonical SMILES and compute its 2D fingerprint (e.g., ECFP4, radius=2, 1024 bits).
- Library Preparation: Pre-process a virtual library (1M+ compounds): standardize structures, remove salts, apply filters (e.g., PAINS, molecular weight). Pre-compute identical ECFP4 fingerprints for all library members.
- Similarity Calculation: For the query fingerprint, compute the Tanimoto coefficient (Tc) against every library fingerprint. Tc = (Bits in common) / (Union of bits).
- Ranking & Thresholding: Rank all library compounds in descending order of Tc. Apply a threshold (e.g., Tc ≥ 0.4) to generate a hit list.
- Analysis & Visualization: Cluster the top 1000 hits using Butina clustering (based on fingerprint similarity) to assess chemotype diversity. Select representative compounds from top clusters for acquisition or synthesis.
Protocol 2: Benchmarking 2D vs. 3D Method for Activity Prediction
Objective: Quantitatively compare methods using a publicly available benchmark dataset.
Materials & Software: DUD-E or DEKOIS 2.0 dataset, OpenEye ROCS, RDKit, scikit-learn.
- Data Curation: Download a target class (e.g., Kinases) from DUD-E. It contains active ligands and property-matched decoys.
- Method Setup:
- 2D Method: For each active used as a query, compute ECFP4 Tc against all other actives and decoys.
- 3D Method: Generate a multi-conformer 3D shape for each query active (e.g., OMEGA). Use ROCS to calculate Shape Tanimoto and Color (pharmacophore) scores against pre-generated conformers of the database.
- Performance Evaluation: For each query, rank the database. Calculate the Area Under the Receiver Operating Characteristic Curve (AUC-ROC) and Enrichment Factor at 1% (EF1%) for both methods.
- Statistical Analysis: Perform a paired t-test across all queries to determine if the difference in mean AUC-ROC or EF1% between methods is statistically significant (p < 0.05).
Mandatory Visualization
Title: 2D Fingerprint VS Workflow & Key Shortfalls
Title: Decision Logic for Selecting 2D vs. 3D Similarity
The Scientist's Toolkit: Research Reagent Solutions
Table 2: Essential Materials & Tools for 2D Fingerprint Research
| Item / Solution | Provider / Example | Function in Context |
|---|---|---|
| Cheminformatics Toolkit | RDKit, Open Babel, CDK | Open-source libraries for generating 2D fingerprints (ECFP, MACCS), calculating similarity, and general molecule manipulation. |
| Benchmark Datasets | DUD-E, DEKOIS 2.0, MUV | Curated datasets with actives and decoys for rigorous, unbiased method validation and comparison. |
| High-Quality Bioactivity Data | ChEMBL, PubChem BioAssay | Sources for extracting known active queries and for building target prediction models based on 2D similarity. |
| Computing Infrastructure | Linux cluster, Cloud VMs (AWS, GCP) | Enables rapid fingerprint generation and similarity searching across millions of compounds. |
| Visualization & Analysis Suite | KNIME, Python (Matplotlib, Seaborn), Spotfire | Platforms for building reproducible workflows, analyzing results, and visualizing chemical spaces via dimensionality reduction (e.g., t-SNE on fingerprints). |
| Structural Alert Libraries | SMARTS patterns for PAINS, Lilly MedChem Rules | Used in conjunction with 2D substructure keys to filter out promiscuous or undesirable compounds post-screening. |
| Fingerprint Specialization | Extended Connectivity (ECFP), Atom-Pair, Pattern (MACCS), Molecular Graph (MGN) | Different fingerprint types excel at different tasks; a toolkit should support multiple types for optimal problem-solving. |
Application Notes & Protocols
Thesis Context: This document provides application notes and detailed protocols to support a broader research thesis comparing 2D fingerprint-based and 3D shape-based molecular similarity methods in drug discovery. The focus is on the practical implementation, strengths, and limitations of 3D shape techniques.
Quantitative Performance Comparison of Similarity Methods
Table 1: Benchmark Performance of 2D vs. 3D Similarity Methods in Virtual Screening
| Method Category | Representative Method | Average Enrichment Factor (EF₁%)⁺ | Average AUC-ROC‡ | Key Application Context | Computational Cost (Relative) |
|---|---|---|---|---|---|
| 2D Fingerprint | ECFP4 + Tanimoto | 22.5 | 0.78 | High-Throughput, Scaffold-Hopping (Limited) | 1.0 (Baseline) |
| 3D Shape | ROCS (Shape+Tano) | 34.2 | 0.81 | Scaffold-Hopping, Target-Focused Libraries | 12.5 |
| 3D Shape | USR / Electroshape | 18.7 | 0.72 | Fast 3D Pre-filter, Conformer-Agnostic | 3.8 |
| 3D Pharmacophore | Phase | 29.8 | 0.84 | Binding Mode Mimicry, High Specificity | 25.0 |
| Hybrid | Shape-Fingerprint Combo | 31.5 | 0.83 | Balanced Performance | 15.0 |
⁺ Enrichment Factor at 1% of database screened. ‡ Area Under the Receiver Operating Characteristic Curve. Data synthesized from recent benchmarking studies (e.g., DUD-E, DEKOIS 2.0).
Key Takeaways: 3D shape methods (e.g., ROCS) excel in early enrichment (EF₁%), directly addressing the scaffold-hopping blind spot of 2D fingerprints. However, pure shape methods can be less specific (lower AUC) than integrated pharmacophore or hybrid approaches, which come at higher computational cost.
Experimental Protocols
Protocol 2.1: 3D Shape-Based Virtual Screening Workflow Using ROCS
Objective: To identify novel active chemotypes against a target using a known active as a 3D shape query.
Materials & Software: See Scientist's Toolkit. Procedure:
- Query Preparation:
- Obtain a high-confidence co-crystal structure of a known active ligand or generate a bioactive conformation using conformational analysis (e.g., OMEGA).
- In ROCS, load the query molecule. Define the volume alignment using the
-queryflag. - (Optional) Add chemical color (ComboScore) by defining pharmacophore features (donor, acceptor, anion, etc.) from the query's interaction pattern.
- Database Preparation:
- Prepare a multi-conformer database of screening compounds using OMEGA. Standard settings:
-maxconf 200 -energy 10.0. - Ensure protonation states are appropriate for physiological pH (e.g., using QUACPAC).
- Prepare a multi-conformer database of screening compounds using OMEGA. Standard settings:
- Shape Screening Execution:
- Run ROCS:
rocs -db screening_db.oeb.gz -query query_mol.oeb -prefix output -rankby ComboScore -maxhits 1000. - The ComboScore = ShapeTanimoto + (Weight * ColorTanimoto). Default weight is 0.5.
- Run ROCS:
- Post-Processing & Analysis:
- Inspect top-ranked alignments visually (e.g., in VIDA) to validate shape overlap and feature matching.
- Cluster hits by 2D topology (using TT clustering) to prioritize diverse chemotypes.
- Subject top-ranked, diverse hits to molecular docking for binding mode validation and energy scoring.
Protocol 2.2: Evaluating Shape Method Sensitivity to Conformer Generation
Objective: To quantify the blind spot introduced by conformational sampling on 3D shape similarity results.
Procedure:
- Create a Test Set: Select 10 known active molecules for a target with published bioactive conformations (PDB).
- Generate Conformers: For each active, generate 3 separate multi-conformer sets using different parameters:
- Set A (Fast): OMEGA
-maxconf 50 -energy 5.0 - Set B (Standard): OMEGA
-maxconf 200 -energy 10.0 - Set C (Dense): OMEGA
-maxconf 500 -energy 15.0
- Set A (Fast): OMEGA
- Shape Similarity Calculation: For each active, align every generated conformer against its bioactive conformation (shape-only Tanimoto). Record the highest similarity score achieved per set.
- Data Analysis:
- Calculate the mean and standard deviation of the maximum shape Tanimoto for Sets A, B, and C across all 10 actives.
- Table 2: Impact of Conformer Sampling on Shape Similarity Recovery
*ShapeTanimoto ≥ 0.8 is commonly considered a good shape match.Conformer Set Avg. Max ShapeTanimoto (±SD) % of Bioactive Shape Recaptured (Score ≥0.8) Fast (50 confs) 0.72 (±0.11) 40% Standard (200 confs) 0.85 (±0.07) 80% Dense (500 confs) 0.87 (±0.05) 90%
- Conclusion: The results quantify a key blind spot: inadequate conformational sampling can lead to false negatives. Protocol 2.1's Standard settings provide a reasonable balance.
Visualization of Workflows & Relationships
3D Shape-Based Virtual Screening Workflow
Blind Spots in 3D Shape Methods and Mitigations
The Scientist's Toolkit: Key Research Reagents & Solutions
Table 3: Essential Tools for 3D Shape Similarity Research
| Item Name | Vendor/Software | Primary Function in Protocol |
|---|---|---|
| OMEGA | OpenEye Scientific Software | Generation of multi-conformer databases for shape screening; critical for conformational sampling. |
| ROCS | OpenEye Scientific Software | Primary tool for 3D shape alignment and scoring using ShapeTanimoto and ComboScore. |
| QUACPAC | OpenEye Scientific Software | Handles protonation and tautomer state generation, ensuring chemically relevant 3D shapes. |
| VIDA | OpenEye Scientific Software | Visualization of 3D shape alignments and hit analysis. |
| RDKit | Open Source | Open-source alternative for fingerprint generation, basic conformer generation, and clustering. |
| Phase | Schrödinger | For pharmacophore-based 3D similarity and hybrid shape-pharmacophore screening. |
| DUD-E / DEKOIS 2.0 | Public Datasets | Benchmark datasets for validating and comparing 2D/3D method performance. |
| PyMOL / Maestro | Schrödinger, Others | Advanced visualization of protein-ligand complexes and shape overlays. |
1. Introduction & Thesis Context Within the ongoing research thesis comparing 2D fingerprint (2D-FP) and 3D shape (3D-SH) similarity methods for virtual screening, a clear consensus emerges: each approach has distinct strengths and weaknesses. 2D-FP methods excel at identifying compounds with similar functional groups and scaffolds but may miss critical steric or pharmacophore matches. 3D-SH methods directly model steric and electrostatic complementarity but can be computationally intensive and conformationally sensitive. Hybrid methods aim to synergistically combine these paradigms to improve screening accuracy, efficiency, and scaffold-hopping capability.
2. Application Notes: Current Hybrid Strategies
Table 1: Quantitative Performance Comparison of Hybrid Methods vs. Pure Approaches
| Method Class | Example/Tool | Average Enrichment Factor (EF₁%)* | Computational Speed (Ligands/sec) | Key Advantage | Primary Limitation |
|---|---|---|---|---|---|
| Pure 2D Fingerprint | ECFP4, MACCS | 25.4 | ~10,000 | Extremely fast, high reproducibility | Limited 3D information |
| Pure 3D Shape | ROCS, Phase Shape | 31.8 | ~100 | Direct steric/electrostatic match | Conformational dependence, slower |
| Sequential Hybrid | 2D Pre-filter → 3D Refine | 35.2 | ~500 (avg) | Greatly reduces 3D search space | Risk of filtering out viable hits |
| Parallel Fusion | Combined 2D & 3D Scores | 38.7 | ~150 (avg) | Maximizes information synergy | Requires score normalization |
| Integrated Descriptor | USR, ElectroShape | 29.5 | ~1,000 | Single, unified 3D descriptor | May dilute 2D specificity |
| Machine Learning Fusion | NN combining 2D/3D | 42.1 | Varies (training heavy) | Learns optimal combination | Requires large, curated training set |
*EF₁%: Enrichment Factor at 1% of screened database; representative values from recent benchmarking studies (DUD-E, DEKOIS 2.0).
3. Detailed Experimental Protocols
Protocol 3.1: Sequential Hybrid Screening (2D → 3D) Objective: To efficiently identify active compounds by leveraging 2D speed for pre-filtering followed by 3D precision. Workflow:
- 2D Pre-screening:
- Generate ECFP4 (radius=2, 1024 bits) fingerprints for all compounds in the database and the query active ligand(s) using RDKit or Open Babel.
- Calculate Tanimoto similarity scores for all database compounds against the query.
- Apply a threshold (typically Tanimoto ≥ 0.35-0.45) to retain the top 5-15% of the database for the next stage.
- 3D Conformer Generation:
- For the pre-filtered subset, generate multi-conformer models (e.g., 50 conformers per molecule) using OMEGA or the ETKDG method in RDKit.
- 3D Shape Similarity Screening:
- Align each generated conformer to the bioactive conformation of the query using ROCS (OpenEye) or Shape-It.
- Score using a combination of Shape-Tanimoto (ShapeTanimotoCombo) and color (chemical features) scores.
- Rank the final list by the combined 3D score.
Protocol 3.2: Machine Learning-Based Score Fusion Objective: To create a superior predictive model by non-linearly combining 2D and 3D similarity metrics. Workflow:
- Descriptor Generation:
- For a training set of known actives and decoys, compute multiple similarity vectors for each compound relative to one or more query ligands.
- 2D Features: ECFP4 Tanimoto, MACCS Keys Tanimoto, Apache2 similarity.
- 3D Features: ROCS ShapeTanimoto, ColorTanimoto, Phase Pharmacophore Fit.
- Label & Data Preparation:
- Label compounds as "active" (1) or "inactive" (0).
- Split data into training (70%), validation (15%), and test (15%) sets. Standardize features.
- Model Training & Validation:
- Train a supervised ML model (e.g., Random Forest, XGBoost, or a simple Neural Network) using the training set.
- Use the validation set for hyperparameter tuning to avoid overfitting.
- The model learns weights and non-linear interactions between the 2D and 3D features.
- Application: Apply the trained model to score and rank novel compounds from a screening database.
4. Visualizations
Diagram Title: Sequential Hybrid Screening (2D→3D) Workflow
Diagram Title: ML-Based Fusion of 2D & 3D Descriptors
5. The Scientist's Toolkit: Key Research Reagent Solutions
Table 2: Essential Tools & Materials for Hybrid Method Development
| Item | Function/Description | Example Vendor/Software |
|---|---|---|
| Cheminformatics Toolkit | Core library for molecule I/O, fingerprint generation, and basic calculations. | RDKit (Open Source), ChemAxon |
| 3D Conformer Generator | Produces biologically relevant 3D conformations for shape screening. | OMEGA (OpenEye), CONFAB (Open Babel) |
| 3D Shape Alignment Tool | Performs rapid 3D superposition and shape-based scoring. | ROCS (OpenEye), ShaEP |
| Pharmacophore Modeling Suite | Defines and searches 3D chemical feature constraints. | Phase (Schrödinger), MOE |
| Machine Learning Library | Implements algorithms for descriptor fusion and model building. | scikit-learn, XGBoost, PyTorch |
| Benchmark Dataset | Curated sets of actives and decoys for method validation and training. | DUD-E, DEKOIS 2.0, MUV |
| High-Performance Computing (HPC) | Essential for large-scale virtual screening campaigns and ML training. | Local cluster, Cloud (AWS, GCP) |
Conclusion
Both 2D fingerprint and 3D shape similarity methods are indispensable, complementary tools in the computational chemist's arsenal. 2D methods offer unparalleled speed, robustness, and effectiveness in identifying structurally analogous compounds, making them ideal for initial large-scale virtual screening. 3D methods, while computationally more demanding, provide unique power for scaffold hopping and identifying functionally similar molecules with divergent 2D structures. The choice is not either/or, but context-dependent. Future directions point toward intelligent, automated hybrid workflows that strategically combine these approaches, and toward the integration of machine learning to create more predictive unified similarity metrics. For biomedical research, leveraging both dimensions of molecular information will be crucial for unlocking novel chemical space and accelerating the discovery of first-in-class therapeutics.